
Release Date :
Reference Number :
SRDDN2025-037
Date of Release: 23 July 2025
Reference No.: SRDDN2025-037
Davao del Norte recorded 326 approved building permits in January 2025
The number of private building constructions from approved building permits in January 2025 in Davao del Norte was 326 units, reflecting a slight decrease of 4.7 percent compared to the 342 units recorded in January 2024. However, this represents an increase of 75 buildings compared to December 2024.
The 326-recorded constructions in Davao del Norte accounted for 42.2 percent of the total private building constructions in the Davao Region during the month under review. These figures include additions, alterations and repairs, and other types of constructions (Table 1).
Residential Buildings accounted for 65.3 percent of the total permitted constructions
Figure 1. Number & Percent Share of Constructions from Approved Building Permits for Residential and Non-Residential Buildings, Davao del Norte: January 2025
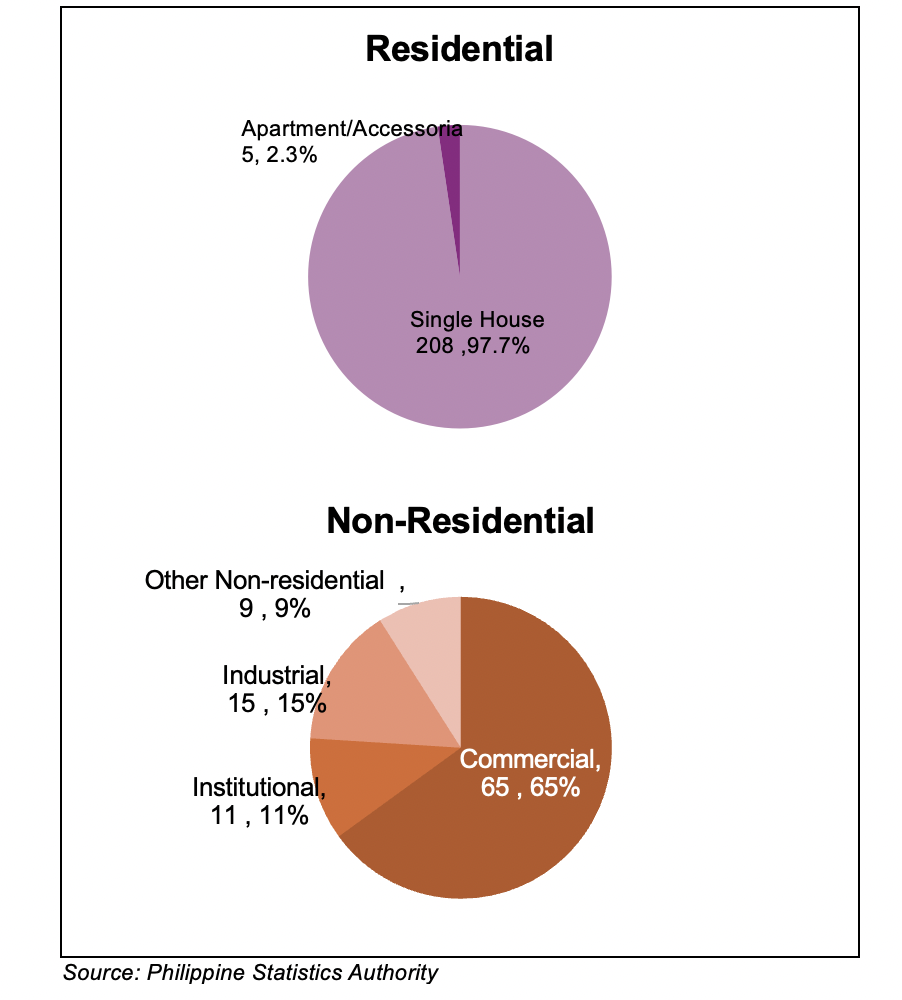
By type of construction, residential buildings totaling 213 units accounted for 65.3 percent of the private building constructions in January 2025. This reflects a marginal increase of 0.5 percent compared to the 212 units recorded in January 2024. About 49.7 percent of the 429 residential buildings constructed in the Davao Region in January 2025 were issued permits in Davao del Norte. The majority of these residential constructions were single-type houses, with 208 units accounting for 97.7 percent of the total (Figure 1 and Table A).
Meanwhile, non-residential types of construction ranked second in terms of the number of constructions, totaling 100 units or 30.7 percent of the overall constructions in 2024, reflecting an 18.0 percent decrease from January 2024. Most of the non-residential constructions were commercial buildings, accounting for 65 units or 65.0 percent. The construction of non-residential buildings in Davao del Norte comprised 38.3 percent of the 261 units recorded in the Davao Region for January 2025 (Figure 1 and Table 1).
Reported total floor area of constructions in Davao del Norte reached 50,060 square meters in January 2025
Figure 2. Floor Area of Constructions from Approved Building Permits by Type,
Davao del Norte: January 2025
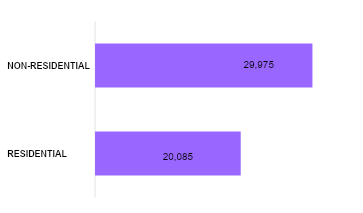
The reported total floor area of constructions in January 2025 was recorded at 50,060 square meters. This excludes alterations and repairs, other non-residential constructions such as facades, helipads, niches, water tanks, and similar structures, as well as other types of constructions like demolitions, street furniture, landscaping, and signboards, since no floor area was reported for these categories.
The total floor area in January 2025 relatively stayed the same compared to the 50,065 square meters recorded in January 2024. The floor area of approved constructions in Davao del Norte accounted for 15.7 percent of the 319.48 thousand square meters recorded in the Davao Region for January 2024 (Figure 2 and Table A).
Non-Residential Buildings accounted for 59.9 percent of total construction floor area
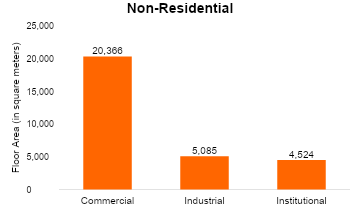
Non-residential constructions accounted for 29,975 square meters, or 59.9 percent of the total floor area of constructions in Davao del Norte in January 2025. This reflects a marginal annual decrease of 0.3 percent from the 30,053 square meters recorded in January 2024. Among non-residential constructions, commercial-type buildings had the largest floor area at 20,366 square meters, comprising 67.9 percent of the non-residential total (Figure 3 and Table A).
Figure 3. Floor Area of Constructions from Approved Building Permits for Residential and Non-Residential Buildings, Davao del Norte: January 2025
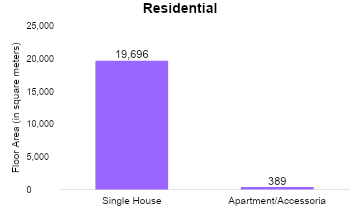
On the other hand, residential buildings recorded a total floor area of 20,085 square meters, or 40.1 percent of the total. This indicates a marginal annual increase of 0.6 percent compared to the 19,966 square meters recorded in January 2024. Among residential constructions, single-type houses accounted for the highest floor area at 19,696 square meters, comprising 98.1 percent of the residential total (Figure 3 and Table A).
Non-Residential Buildings recorded the highest value of constructions
In January 2025, the total value of constructions in Davao del Norte amounted to PhP 444.99 million, indicating an annual increase of 41.8 percent from the PhP 330.03 miliion recorded in January 2024 (Table A).
Figure 4. Value of Constructions from Approved Building Permits for Residential and Non-Residential Buildings, Davao del Norte: January 2025
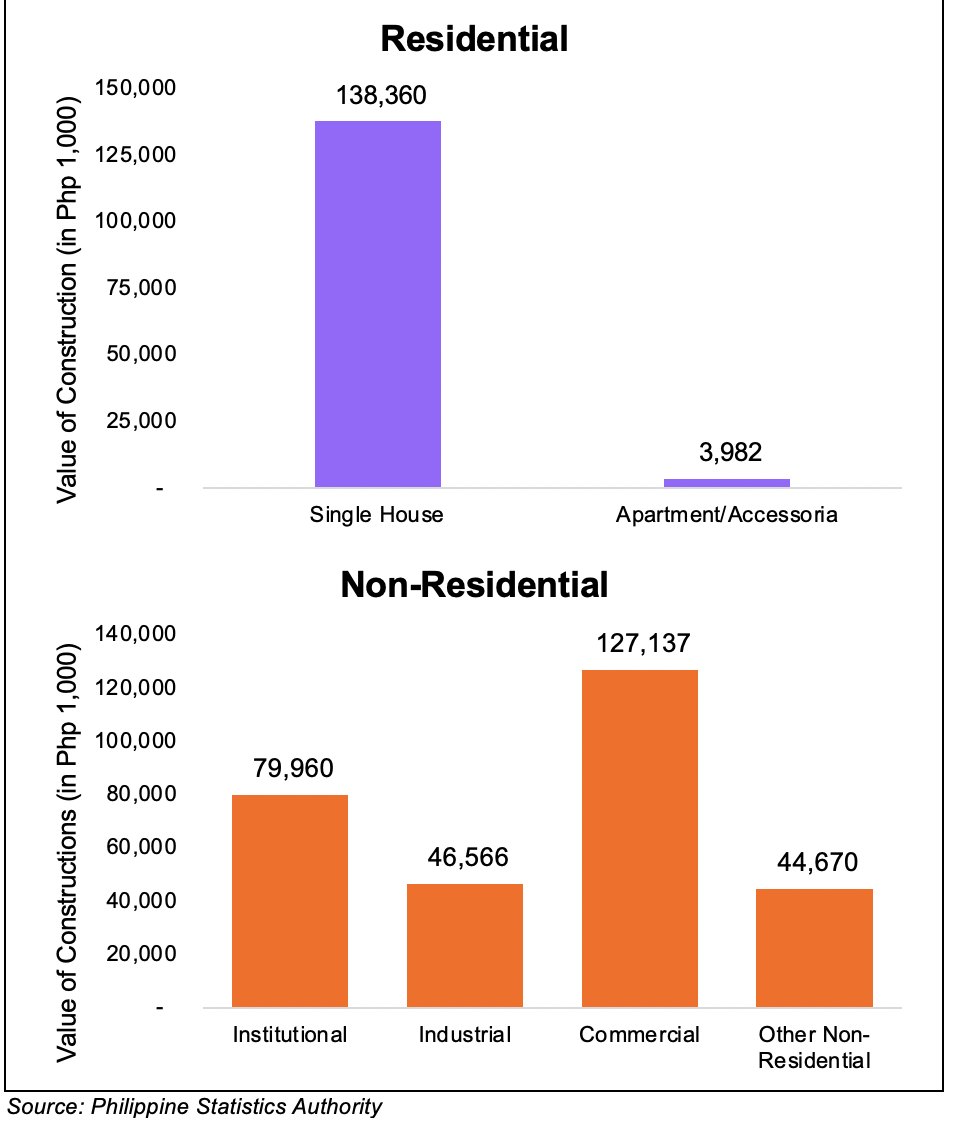
Non-residential building constructions, valued at PhP 298.33 million, accounted for 67.0 percent of the total construction value in the province for January 2025. This represents an annual increase two times from the PhP 145.24 million recorded in January 2024. Among non-residential constructions, commercial-type buildings had the highest value at PhP 127.13 million, comprising 42.6 percent of the non-residential total. (Figure 4 and Table A).
Meanwhile, the construction value of residential buildings amounted to PhP 142.34 million, or 32.0 percent of the total construction value registered in January 2025. This reflects an annual decrease of 13.1 percent from the PhP 163.81 million reported in January 2024. Among residential constructions, single-type houses posted the highest value at PhP 138.36 million, accounting for 97.2 percent of the residential total (Figure 4 and Table A).
Apartments & Institutional-type Buildings recorded the highest average cost of Residential & Non-residential constructions
The average cost of constructions in January 2025 was recorded at PhP 7,996.84 per square meter. Alterations and repairs, other non-residential constructions such as facades, helipads, niches, water tanks, and similar structures, as well as other types of constructions including demolitions, street furniture, landscaping, and signboards, were excluded from the computation since no floor area was reported for these categories.
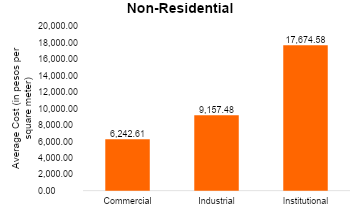
Among the types of constructions, non-residential buildings registered the highest average cost at PhP 8,462.47 per square meter in January 2025. Within non-residential constructions, institutional buildings reported the highest average cost at PhP 17,674.58 per square meter, while commercial-type constructions recorded the lowest at PhP 6,242.61 per square meter.
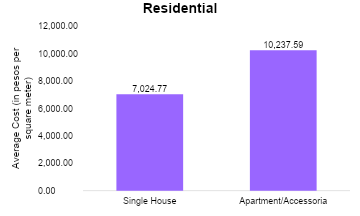
For residential constructions, the province of Davao del Norte recorded an average cost of PhP 7,086.99 per square meter. Among residential types, apartments posted the highest average cost at PhP 10,237.59 per square meter in January 2025, while single-type houses registered the lowest at PhP 7,024.77 per square meter (Figure 5 and Table A).
Figure 5. Average Cost per Square Meter for Residential and Non-residential Constructions, Davao del Norte: January 2025
MICHELLE O. MANINGO
(Supervising Statistical Specialist)
Officer-in-Charge

MAA