
Release Date :
Reference Number :
SRDDN2025-034
Date of Release: 03 July 2025
Reference No.: SRDDN2025-034
Number of constructions in Davao del Norte decreased by 33 units in 2024
The number of private building constructions from approved building permits in 2024 in Davao del Norte was 3,700 units, reflecting a marginal decrease of 0.9 percent compared to the 3,733 units recorded in 2023. This decline is smaller than the annual rate of -2.1 percent recorded in 2023.
The 3,700 recorded constructions in Davao del Norte accounted for 39.0 percent of the total private building constructions in the Davao Region, and 2.1 percent of the total private building constructions in the entire country during the year under review. These figures include additions, alterations and repairs, and other types of constructions (Table A).
Residential Buildings accounted for 69.0 percent of the total permitted constructions
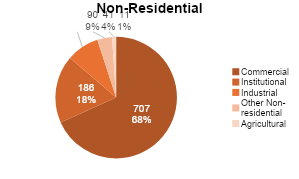
Figure 1. Number and Percent Share of Constructions from Approved Building Permits for Residential and Non-Residential Buildings, Davao del Norte: 2024
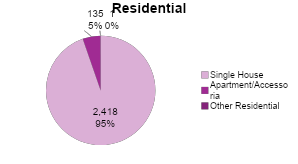
By type of construction, residential buildings totaling 2,554 units accounted for 69.0 percent of the private building constructions in 2024. This reflects a decrease of 4.1 percent compared to the 2,663 units recorded in 2023. About 45.0 percent of the 5,667 residential buildings constructed in the Davao Region in 2024 were issued permits in Davao del Norte. The majority of these residential constructions were single-type houses, with 2,418 units accounting for 94.7 percent of the total (Figure 1 and Table A).
Meanwhile, non-residential types of construction ranked second in terms of the number of constructions, totaling 1,035 units or 28.0 percent of the overall constructions in 2024. This figure remained unchanged from 2023. Most of the non-residential constructions were commercial buildings, accounting for 707 units or 68.3 percent. The construction of non-residential buildings in Davao del Norte comprised 32.9 percent of the 3,148 units recorded in the Davao Region for the year 2024 (Figure 1 and Table 1).
Reported total floor area of constructions in Davao del Norte increased by 6.8 percent in 2024
Figure 2. Floor Area of Constructions from Approved Building Permits by Type,
Davao del Norte: 2024
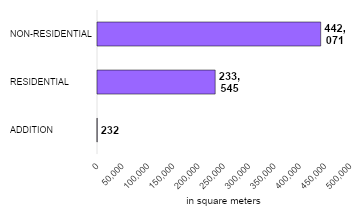
The reported total floor area of constructions in 2024 was recorded at 675.85 thousand square meters. This excludes alterations and repairs, other non-residential constructions such as facades, helipads, niches, water tanks, and similar structures, as well as other types of constructions like demolitions, street furniture, landscaping, and signboards, since no floor area was reported for these categories.
The total floor area in 2024 reflected an annual increase of 6.8 percent compared to the 632.84 thousand square meters recorded in 2023. The floor area of approved constructions in Davao del Norte accounted for 32.2 percent of the 2.10 million square meters recorded in the Davao Region for the year 2024 (Figure 2 and Table A).
Non-Residential Buildings accounted for 65.4 percent of total construction floor area
Non-residential constructions accounted for 442.07 thousand square meters, or 65.4 percent of the total floor area of constructions in Davao del Norte in 2024. This reflects an annual increase of 3.3 percent from the 428.09 thousand square meters recorded in the previous year. Among non-residential constructions, commercial-type buildings had the largest floor area at 160.92 thousand square meters, comprising 36.4 percent of the non-residential total (Figure 3 and Table A).
Figure 3. Floor Area of Constructions from Approved Building Permits for Residential and Non-Residential Buildings, Davao del Norte: 2024
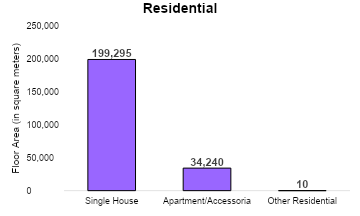
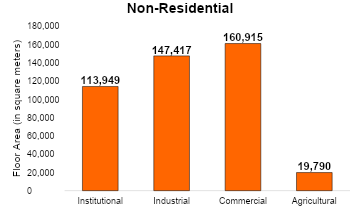
On the other hand, residential buildings recorded a total floor area of 233.55 thousand square meters, or 34.6 percent of the total. This indicates an annual increase of 14.1 percent compared to the 204.75 thousand square meters recorded in the previous year. Among residential constructions, single-type houses accounted for the highest floor area at 199.30 thousand square meters, comprising 85.3 percent of the residential total (Figure 3 and Table A).
Non-Residential Buildings recorded the highest value of constructions
In 2024, the total value of constructions in Davao del Norte amounted to PhP 5.58 billion, indicating an annual increase of 1.8 percent from the PhP 5.48 billion recorded in 2023 (Table A).
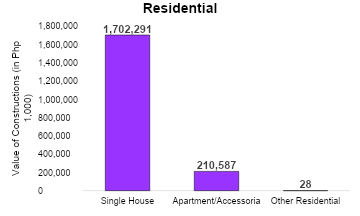
Figure 4. Value of Constructions from Approved Building Permits for Residential
and Non-Residential Buildings, Davao del Norte: 2024
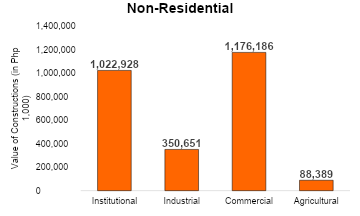
Non-residential building constructions, valued at PhP 2.65 billion, accounted for 47.6 percent of the total construction value in the province for 2024. This represents an annual decrease of 23.9 percent from the PhP 3.49 billion recorded in 2023. Among non-residential constructions, commercial-type buildings had the highest value at PhP 1.18 billion, comprising 44.3 percent of the non-residential total. (Figure 4 and Table A).
Meanwhile, the construction value of residential buildings amounted to PhP 1.91 billion, or 34.3 percent of the total construction value registered in 2024. This reflects an annual increase of 6.6 percent from the PhP 1.79 billion reported in the previous year. Among residential constructions, single-type houses posted the highest value at PhP 1.70 billion, accounting for 89.0 percent of the residential total (Figure 4 and Table A).
Average cost of construction in Davao del Norte recorded 6,876 pesos per square meter
The average cost of constructions in 2024 was recorded at PhP 6,876.97 per square meter. Alteration and repair, other non-residential such as facade, helipad, niche, water tank, etc., and other constructions, which include demolition, street furniture, landscaping, and signboards, were excluded in the average cost of construction since there is no reported floor area for these types of construction.
Figure 5. Average Cost per Square Meter from Approved Building Permits by Type,
Davao del Norte: 2024
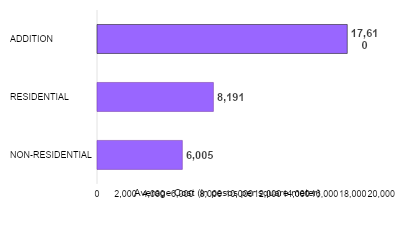
Among types of constructions, addition to existing structures registered the highest average cost of PhP 17,610.14 per square meter in 2024. This was followed by residential buildings with PhP 8,190.74 per square meter and non-residential constructions with PhP 6,004.75 per square meter (Figure 5 and Table A).
Single-Type Houses & Institutional-type Buildings recorded the highest average cost of Residential & Non-residential constructions
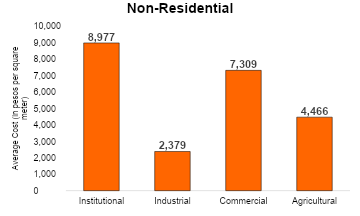
Figure 6. Average Cost per Square Meter for Residential and Non-residential Constructions, Davao del Norte: 2024
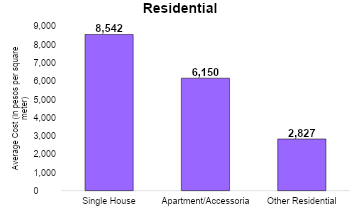
Among residential constructions, single-type houses posted the highest average cost of PhP 8,541.57 per square meter in 2024. Meanwhile, other types of residential constructions such as container van house, staff housing, servants quarter, etc. recorded the lowest average cost of PhP 2,826.50 per square meter. (Figure 6 and Table A)
Across non-residential constructions, institutional buildings reported the highest average cost of PhP 8,977.07 per square meter in 2024. On the other hand, industrial-type constructions registered the lowest average cost per square meter at PhP 2,378.63. (Figure 6 and Table A)
MICHELLE O. MANINGO
(Supervising Statistical Specialist)
Officer-in-Charge

MAA
| Attachment | Size |
|---|---|
|
|
596.61 KB |