| Region/Province | Annual Per Capita Poverty Threshold (in Pesos) | Poverty Incidence among Families (%) | Magnitude of Poor Families | |||||
| Estimates(%) | Coefficient of Variation | Estimate (in thousands) | ||||||
| 2018 | 2021 | 2018 | 2021 | 2018 | 2021 | 2018 | 2021 | |
| Philippines | 12,638 | 14,498 | 16.2 | 18.0 | 1.1 | 1.2 | 4,039.4 | 4,739.8 |
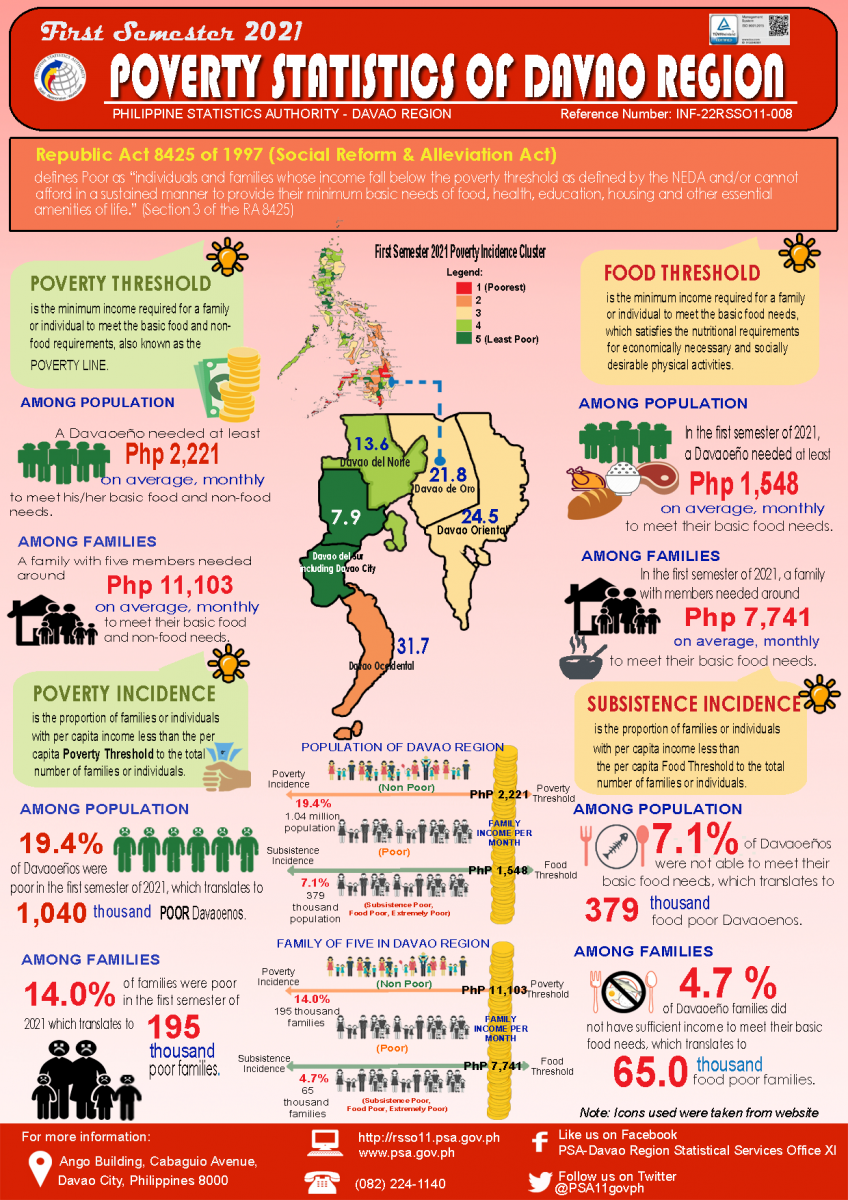
| Region XI | 12,718 | 13,324 | 17.8 | 14.0 | 4.0 | 4.4 | 233.2 | 195.5 |
| Davao del Norte | 12,725 | 13,545 | 14.5 | 13.6 | 10.3 | 10.3 | 37.4 | 34.5 |
| Davao del Sur (without Davao City) | 12,808 | 13,203 | 18.7 | 13.1 | 7.9 | 10.9 | 32.4 | 25.7 |
| Davao City | 12,994 | 13,510 | 7.8 | 6.0 | 18.5 | 14.5 | 35.9 | 31.2 |
| Davao Oriental | 12,636 | 13,788 | 32.6 | 24.5 | 6.6 | 8.8 | 46.8 | 36.3 |
| Davao de Oro | 12,532 | 12,942 | 26.0 | 21.8 | 6.7 | 8.2 | 49.4 | 41.2 |
| Davao Occidental | 12,669 | 12,834 | 37.7 | 31.7 | 6.5 | 8.4 | 31.4 | 26.7 |
Table 2. Annual Per Capita Poverty Threshold, Poverty Incidence and Magnitude of Poor Population, by Region and Province and Highly Urbanized City: First Semester 2018 and 2021
| Region/Province | Annual Per Capita Poverty Threshold (in Pesos) | Poverty Incidence among Population (%) | Magnitude of Poor Population | |||||
| Estimates(%) | Coefficient of Variation | Estimate (in thousands) | ||||||
| 2018 | 2021 | 2018 | 2021 | 2018 | 2021 | 2018 | 2021 | |
| Philippines | 12,638 | 14,498 | 21.1 | 23.7 | 1.1 | 1.1 | 22,162.4 | 26,136.8 |
| Region XI | 12,718 | 13,324 | 23.8 | 19.4 | 4.0 | 4.1 | 1,220.1 | 1,039.6 |
| Davao del Norte | 12,725 | 13,545 | 18.9 | 17.9 | 10.4 | 10.2 | 196.5 | 190.5 |
| Davao del Sur (without Davao City) | 12,808 | 13,203 | 24.6 | 18.1 | 7.6 | 9.6 | 164.5 | 128.0 |
| Davao City | 12,994 | 13,,510 | 11.3 | 8.9 | 17.8 | 14.4 | 196.7 | 166.7 |
| Davao Oriental | 12,636 | 13,788 | 42.0 | 32.7 | 6.2 | 7.8 | 138.8 | 199.0 |
| Davao de Oro | 12,532 | 12,942 | 32.5 | 27.9 | 6.9 | 8.1 | 247.0 | 218.1 |
| Davao Occidental | 12,669 | 12,834 | 47.3 | 40.1 | 5.9 | 7.6 | 276.7 | 137.4 |