
Release Date :
Reference Number :
SR-2025-030
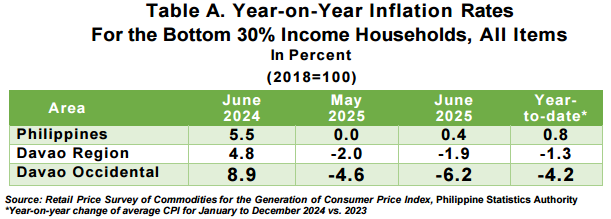
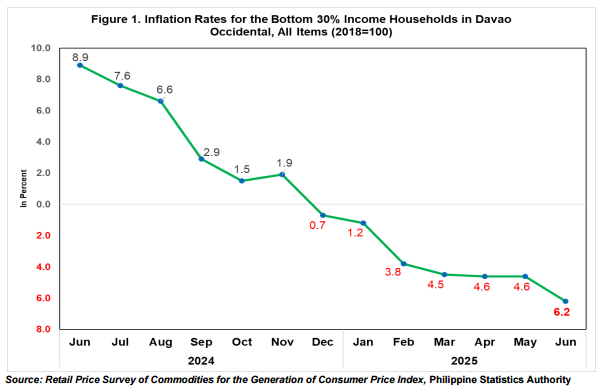
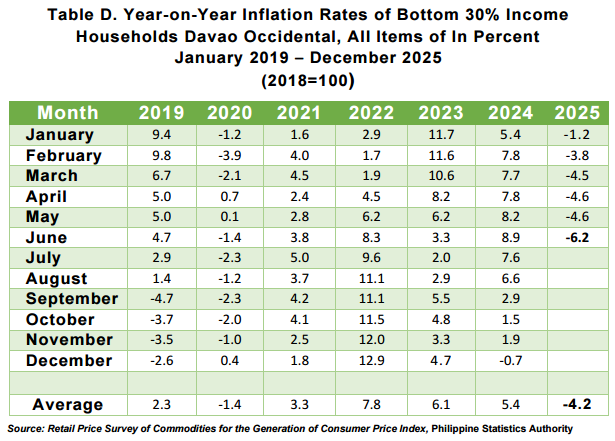
The Davao Occidental headline inflation rate for the bottom 30% income households declined further to negative 6.2 percent in June 2025 from negative 4.6 in May 2025. In June 2024, the inflation rate was higher at 8.9 percent. (Table A and Figure 1)
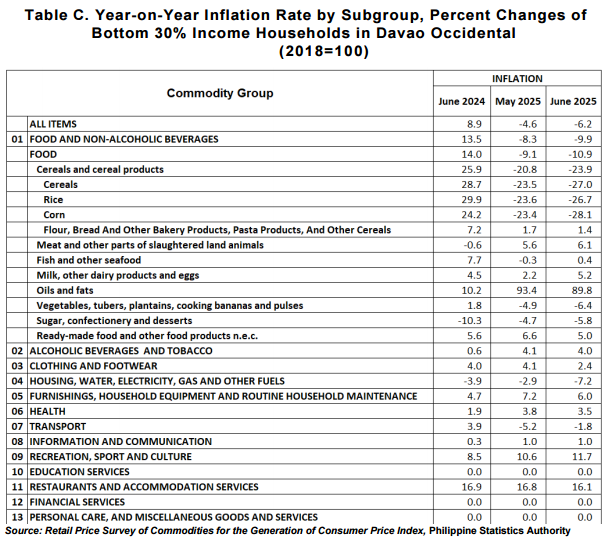
The drivers of the downward trend of the overall inflation for this income group in June 2025 was the slower year-on-year growth of the following commodity groups;
a. Restaurants and accommodation services, from 16.8 percent to 16.1 percent;
b. Furnishing, household equipment and routine household maintenance, from 7.2 percent to 6.0 percent;
c. Alcoholic beverages and tobacco, from 4.1 percent to 4.0 percent;
d. Health, from 3.8 percent to 3.5 percent;
e. Clothing and footwear, from 4.1 percent to 2.4 percent;
f. Housing, water, electricity, gas and other fuels, from negative 2.9 percent to negative 7.2 percent; and
g. Food and non-alcoholic beverages from negative 8.3 percent to negative 9.9 percent.
In contrast, higher annual growth rates were noticed in the following commodity groups;
a. Recreation, sport and culture, from 10.6 percent to 11.7 percent; and
b. Transport, from negative 5.2 percent to negative 1.8 percent.
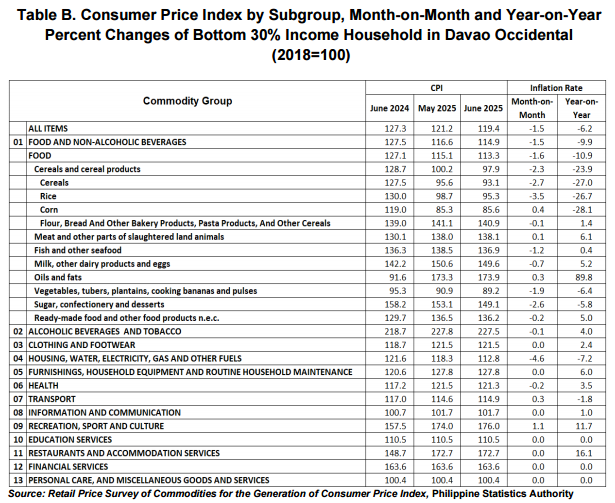
The indices of the rest of the commodity groups retained their respective previous month’s annual rates. (Tables B)
Food inflation for the bottom 30% income households at the provincial level decreased to negative 10.9 percent in June 2025 from negative 9.1 percent in May 2025. In June 2024, the inflation rate was higher at 14.0 percent.
The deceleration of food inflation in June 2025 of this income group were contributed of the following food groups;
a. Oils and fats, from 93.4 percent to 89.8 percent;
b. Ready-made food and other food products n.e.c., from 6.6 percent to 5.0 percent;
c. Flour, Bread and Other Bakery Products, Pasta Products, and Other Cereals, from 1.7 percent to 1.4 percent;
d. Sugar, confectionery and desserts from negative 4.7 percent to negative 5.8 percent;
e. Vegetables, tubers, plantains, cooking bananas and pulses from negative 4.9 percent to negative 6.4 percent;
f. Rice, from negative 23.6 percent to negative 26.7 percent; and
g. Corn, from negative 23.4 percent to negative 28.1 percent.
In contrast, compared with their previous month’s inflation rates, higher annual growth rate was observed in the following food groups;
a. Meat and other parts of slaughtered land animals from 5.6 percent to 6.1 percent;
b. Milk, other dairy products and eggs, from 2.2 percent to 5.2 percent; and
c. Fish and other seafood, from negative 0.3 percent to 0.4 percent. (Table C)
Note: CPIs and inflation rates for the bottom 30% income households
by region and province are posted at the PSA OpenSTAT portal at
https://openstat.psa.gov.ph/PXWeb/pxweb/en/DB/DB__2M__PI__BIH_
_2018/?tablelist=true .
Approved for Release:
JESSIE A. MADULIN
Chief Statistical Specialist
| Attachment | Size |
|---|---|
|
|
565.99 KB |