
Release Date :
Reference Number :
SR-2025-016
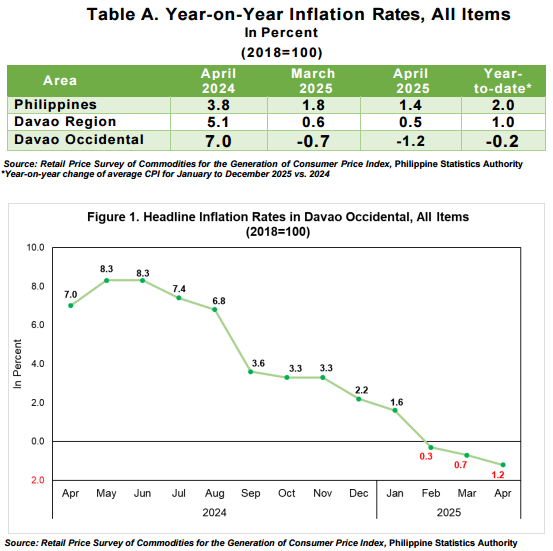
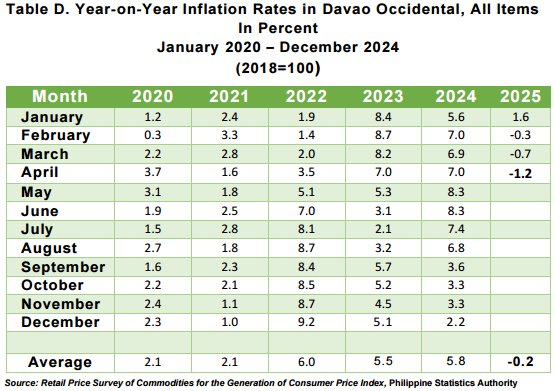
The Davao Occidental annual headline inflation declined further to negative 1.2 percent in April 2025 from negative 0.7 percent in March 2025. In April 2024, the inflation rate was higher at 7.0 percent. (Table A and Figure 1)
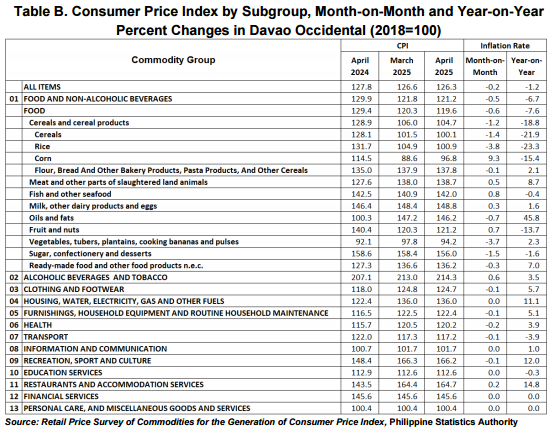
The main sources of down trend of the province inflation in April 2025 were contributed by the slower movement of prices of the following commodity groups;
a. Recreation, sport and culture, from 14.5 percent to 12.0 percent;
b. Clothing and footwear, from 6.2 percent to 5.7 percent;
c. Furnishings, household equipment and routine household maintenance, from 6.2 percent to 5.1 percent;
d. Health, from 4.5 percent to 3.9 percent;
e. Transport, from negative 2.7 percent to negative 3.9 percent; and
f. Food and non-alcoholic beverages, from negative 6.0 percent to negative 6.7 percent.
In contrast, faster annual inflation was noted in the indices of the following commodity groups during the month;
a. Housing, water, electricity, gas and other fuels, from 10.9 percent to 11.1 percent;
b. Restaurant and accommodation services, from 14.6 percent to 14.8 percent; and
c. Alcohol beverages and tobacco, from 1.9 percent to 3.5 percent.
On the other hand, information and communication, and education services retained their inflation with the previous month at 1.0 percent and negative 0.3 percent, respectively.
While the financial services, and personal care, and miscellaneous goods and services and remained at zero growth during the month. (Tables B)
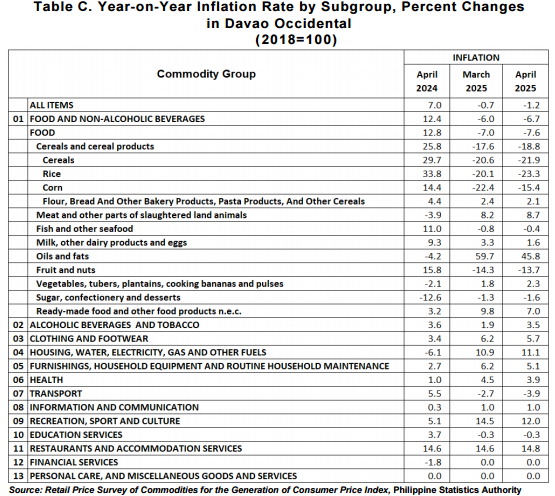
The food inflation at the provincial level slightly decreased to negative 7.6 percent in April 2025 from negative 7.0 percent in March 2025. In April 2024, the food inflation was higher at 12.8 percent.
The deceleration of food inflation in April 2025 were contributed by the slower inflation of the following food groups;
a. Oils and fats from 59.7 percent to 45.8 percent;
b. Ready-made food and other food products n.e.c from 9.8 percent to 7.0 percent;
c. Milk, other dairy products and eggs, from 3.3 percent to 1.6 percent;
d. Sugar, confectionery and desserts from negative 1.3 percent to negative 1.6 percent; and
e. Rice, from negative 20.1 percent to negative 23.3 percent;
On the other hand, compared with their previous month’s inflation rates, higher annual growth rates during the month were observed on the following food groups;
a. Meat and other parts of slaughtered land animals from 8.2 percent to 8.7 percent;
b. Vegetables, tubers, plantains, cooking bananas and pulses from 1.8 percent to 2.3 percent;
c. Fish and other seafoods, from negative 0.8 percent to negative 0.4 percent;
d. Fruits and nuts, from negative 14.3 percent to negative 13.7 percent; and
e. Corn, from negative 24.4 percent to negative 15.4 percent. (Table C)
Technical Notes:
Consumer Price Index (CPI) - The CPI is an indicator of the change in the average retail prices of a fixed basket of goods and services commonly purchased by households relative to a base year.
Inflation Rate (IR) - The inflation rate is the annual rate of change, or the year-on-year change of the CPI expressed in percent. Inflation is interpreted in terms of declining purchasing power of money.
Headline Inflation - measures changes in the cost of living based on movements in the prices of a specified basket of major commodities. It refers to the annual rate of change or the year on-year change in the Consumer Price Index (CPI).
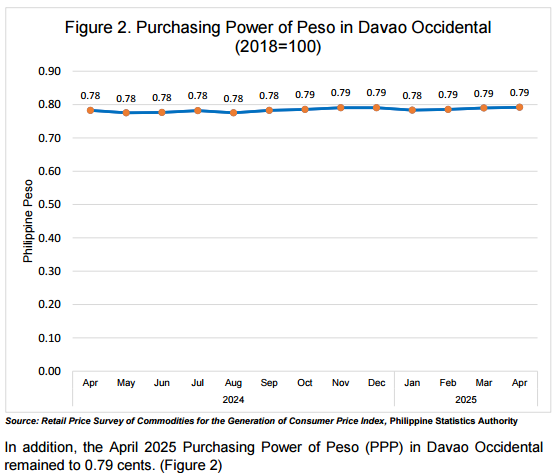
Purchasing Power of the Peso (PPP) - The purchasing power of the peso shows how much the peso in the base period is worth in the current period. It is computed as the reciprocal of the CPI for the period under review multiplied by 100.
APPROVED FOR RELEASE:
JESSIE A. MADULIN
Chief Statistical Specialist
| Attachment | Size |
|---|---|
|
|
476.51 KB |