Summary Inflation Report: April 2024 Consumer Price Index for Bottom 30% Income Households: Davao del Norte (2018=100)
Release Date :
Reference Number :
SRDDN2024-014
SPECIAL RELEASE
Summary Inflation Report: April 2024
Consumer Price Index for Bottom 30% Income Households: Davao del Norte
(2018=100)
Date of Release
:
08 May 2024
Reference No.
:
SRDDN2024-014
Table A. Year-on-Year Inflation Rates for Bottom 30% Income Households in the Philippines, Region 11, and Davao del Norte: April 2023, March – April 2024 (All Items in Percent)
Area
April 2023
March 2024
April 2024
Year-to-Date*
Philippines
7.4
4.6
5.2
4.4
Region 11
9.0
5.3
5.5
5.0
Davao del Norte
5.5
2.3
3.6
1.8
Year-on-year change of average CPI for January to April 2024 vs. 2023
Source: Retail Price Survey of Commodities for the Generation of Consumer Price Index Philippine
Statistics Authority
Source: Retail Price Survey of Commodities for the Generation of Consumer Price Index Philippine Statistics Authority
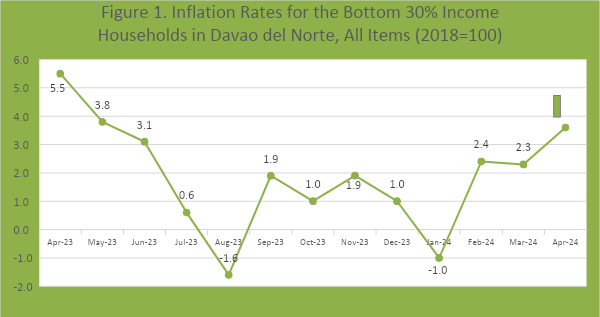
Inflation in Davao del Norte
The inflation in Davao del Norte for bottom 30% income households decreased by 1.9 percentage points in April 2024 (3.6%) compared to its inflation rate in the same month last year, which was recorded at 5.5 percent. The current inflation rate (3.6%) in the province is lower compared to the inflation in the Philippines and Davao Region, which stood at 5.2 percent and 5.5 percent, respectively (Table A).
Table B.
Year-on-Year Inflation Rates for Bottom 30% Income Households in Davao del Norte: January 2021 – April 2024 (All Items in Percent)
Month
2021
2022
2023
2024
January
2.1
7.5
9.8
-1.0
February
2.5
5.6
9.0
2.4
March
2.1
5.8
7.9
2.3
April
1.2
6.5
5.5
3.6
May
1.9
6.9
3.8
June
2.4
8.0
3.1
July
3.2
10.5
0.6
August
3.7
10.7
-1.6
September
3.4
11.2
1.9
October
4.8
10.3
1.0
November
4.5
9.9
1.9
December
5.7
9.6
1.0
Average
3.1
8.5
3.6
1.8
Source: Retail Price Survey of Commodities for the Generation of Consumer Price Index, Philippine Statistics Authority
Contribution to the Inflation
Table C showed that the April 2024 inflation for the bottom 30% income households in Davao del Norte was mostly contributed by the indices of food and non-alcoholic beverages (10.4%); transport (5.2%); and alcoholic beverages and tobacco (12.4%).
Table C.
Major Contributor to the Inflation in Davao del Norte: Bottom 30% Income Households in Percent (2018=100)
Commodity Group
April 2023
March 2024
April 2024
Contribution to Inflation
ALL ITEMS
5.5
2.3
3.6
100.0
Food and non-alcoholic beverages
8.0
8.8
10.4
146.1
Alcoholic beverages and tobacco
4.0
10.7
12.4
5.7
Clothing and footwear
2.3
7.4
7.1
3.9
Housing, water, electricity, gas and other fuels
2.5
(20.4)
(18.5)
(74.1)
Furnishings, household equipment and routine household maintenance
3.5
3.6
3.3
1.8
Health
21.2
(3.4)
(4.3)
(1.3)
Transport
0.7
3.6
5.2
9.3
Information and communication
0.0
0.0
0.0
0.0
Recreation, sport and culture
11.2
9.7
8.0
1.4
Education services
3.9
3.2
3.2
0.3
Restaurants and accommodation services
0.0
1.4
1.4
2.1
Financial services
0.0
(0.1)
(0.1)
(0.0)
Personal care, and miscellaneous goods and services
3.4
3.8
3.6
4.8
Source: Retail Price Survey of Commodities for the Generation of Consumer Price Index Philippine Statistics Authority
Share to the Trend of Inflation
Table D.
Share to the Uptrend of Inflation in Davao del Norte: Bottom 30% income Households in Percent (2018=100)
Commodity Group
April 2023
March 2024
April 2024
Share to Downtrend
ALL ITEMS
5.5
2.3
3.6
100.0
Food and non-alcoholic beverages
8.0
8.8
10.4
66.6
Alcoholic beverages and tobacco
4.0
10.7
12.4
2.3
Clothing and footwear
2.3
7.4
7.1
Housing, water, electricity, gas and other fuels
2.5
(20.4)
(18.5)
22.6
Furnishings, household equipment and routine household maintenance
3.5
3.6
3.3
Health
21.2
(3.4)
(4.3)
Transport
0.7
3.6
5.2
8.5
Information and communication
0.0
0.0
0.0
Recreation, sport and culture
11.2
9.7
8.0
Education services
3.9
3.2
3.2
Restaurants and accommodation services
0.0
1.4
1.4
Financial services
0.0
(0.1)
(0.1)
Personal care, and miscellaneous goods and services
3.4
3.8
3.6
Source: Retail Price Survey of Commodities for the Generation of Consumer Price Index Philippine Statistics Authority
The increment in the inflation rate of the bottom 30% income households in Davao del Norte can be observed with its upward trend from 2.3 percent in March 2024 to 3.6 percent in April 2024. This trend was mainly contributed by the faster annual increase of the index for food and non-alcoholic beverages from a rate of 8.8 percent in March 2024 to 10.4 percent in April 2024. This was followed by the indices of housing, water, electricity, gas and other fuels (from -20.4% to -18.5%), and transport (from 3.6% to 5.2%) (Table D).
Despite the increase of inflation rate of the province in April 2024, a decrease in the inflation rate compared last month can be noticed for the following commodity groups:
Clothing and footwear (from 7.4% to 7.1%);
Furnishings, household equipment and routine household maintenance (from 3.6% to 3.3%);
Health (from -3.4% to -4.3%);
Recreation, sport and culture (from 9.7% to 8.0%); and
Personal care, and miscellaneous goods and services (from 3.8% to 3.6%)
It can also be observed that the commodities for information and communication; education services; restaurants and accommodation services; and financial services has shown no sign of increase nor decrease in inflation rate compared to their corresponding rates in the last month.
The bottom 30% income households inflation rate of the index for food has shown an upward trend from an inflation rate of 9.3% in March 2024 to 11.1% in April 2024. The trend of the food inflation was mostly attributed by the faster annual increase in the index for vegetables, tubers, plantains, cooking bananas and pulses, which recorded an inflation rate of 20.5% in April 2024 from a rate of 5.6% in March 2024. This was followed by the indices for fish and other seafood (from 0.5% to 5.5%); and ready-made food and other food products n.e.c. (from 6.2% to 9.2%) (Table E.)
Table E.
Share to the Trend of Food Inflation in Davao del Norte: Bottom 30% Income Households in Percent (2018=100)
Commodity Group
April 2023
March 2024
April 2024
Share to Uptrend
FOOD
8.1
9.3
11.1
100.0
Rice
5.5
29.0
27.0
Corn
16.1
(2.7)
0.4
Flour, Bread and Other Bakery Products, Pasta Products, And Other Cereals
4.2
7.6
7.0
Meat and other parts of slaughtered land animals
7.0
(2.2)
(2.8)
Fish and other seafood
12.3
0.5
5.5
42.1
Milk, other dairy products and eggs
6.2
0.5
0.1
Oils and fats
16.0
(2.2)
(5.0)
Fruits and nuts
5.0
29.4
28.5
Vegetables, tubers, plantains, cooking bananas and pulses
0.1
5.6
20.5
52.1
Sugar, confectionery and desserts
46.8
1.6
2.8
1.3
Ready-made food and other food products n.e.c.
6.7
6.2
9.2
4.5
Source: Retail Price Survey of Commodities for the Generation of Consumer Price Index Philippine Statistics Authority