
Release Date :
Reference Number :
SRDDN2025-038
Date of Release: 5 August 2025
Reference No.: SRDDN2025-038
Davao del Norte recorded 402 approved building permits in February 2025
The number of private building constructions from approved building permits in February 2025 in Davao del Norte was 402 units, reflecting a significant increase of 72.5 percent compared to the 233 units recorded in February 2024. This also represent an increase of 76 buildings compared to January 2025.
The 402-recorded constructions in Davao del Norte accounted for 44.9 percent of the total private building constructions in the Davao Region during the month under review. These figures include additions, alterations and repairs, and other types of constructions (Table 1).
Residential Buildings accounted for 73.9 percent of the total permitted constructions
Figure 1. Number & Percent Share of Constructions from Approved Building Permits for Residential and Non-Residential Buildings, Davao del Norte: February 2025
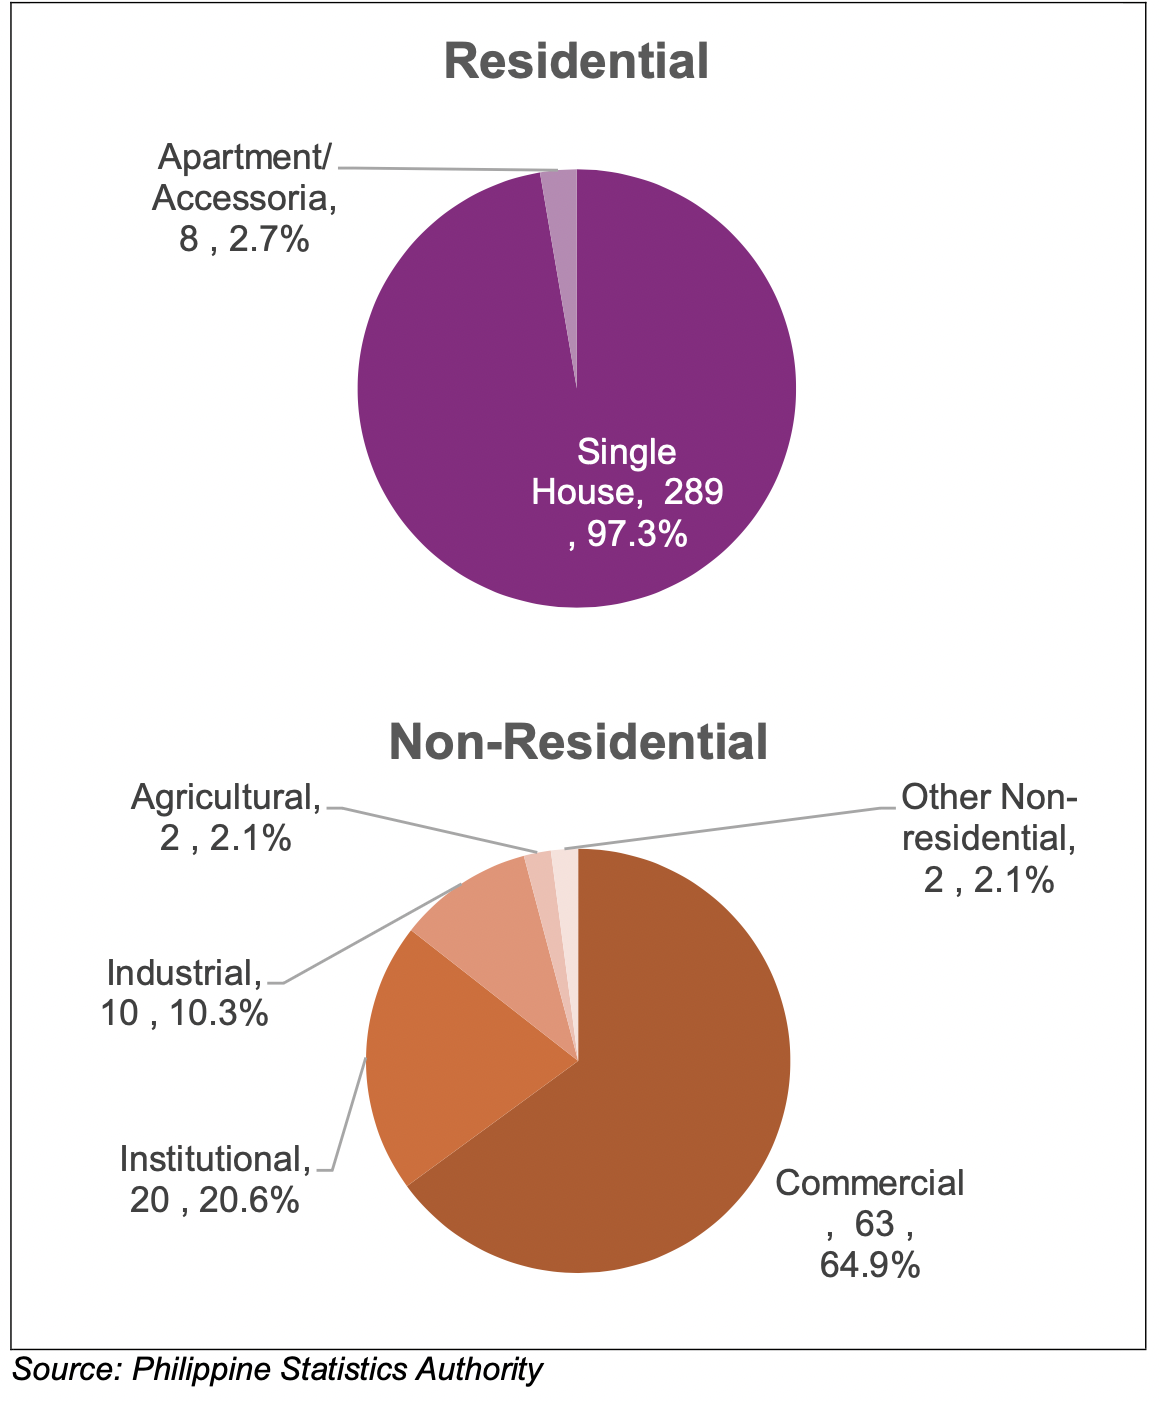
By type of construction, residential buildings totaling 297 units accounted for 73.9 percent of private building constructions in February 2025. This reflects a significant increase of 78.9 percent compared to the 166 units recorded in February 2024. About 53.2 percent of the 558 residential buildings constructed in the Davao Region in February 2025 were issued permits in Davao del Norte. The majority of these residential constructions were single-type houses, with 289 units accounting for 97.3 percent of the total (Figure 1 and Table A).
Meanwhile, non-residential constructions totaled 97 units, or 24.1 percent of the overall constructions in February 2025, reflecting a 51.6 percent increase compared to February 2024. Most of the non-residential constructions were commercial buildings, accounting for 63 units or 64.9 percent. Non-residential constructions in Davao del Norte comprised 39.0 percent of the 249 units recorded in the Davao Region for February 2025 (Figure 1 and Table 1).
Reported total floor area of constructions in Davao del Norte reached 111,175 square meters in February 2025
Figure 2. Floor Area of Constructions from Approved Building Permits by Type,
Davao del Norte: February 2025
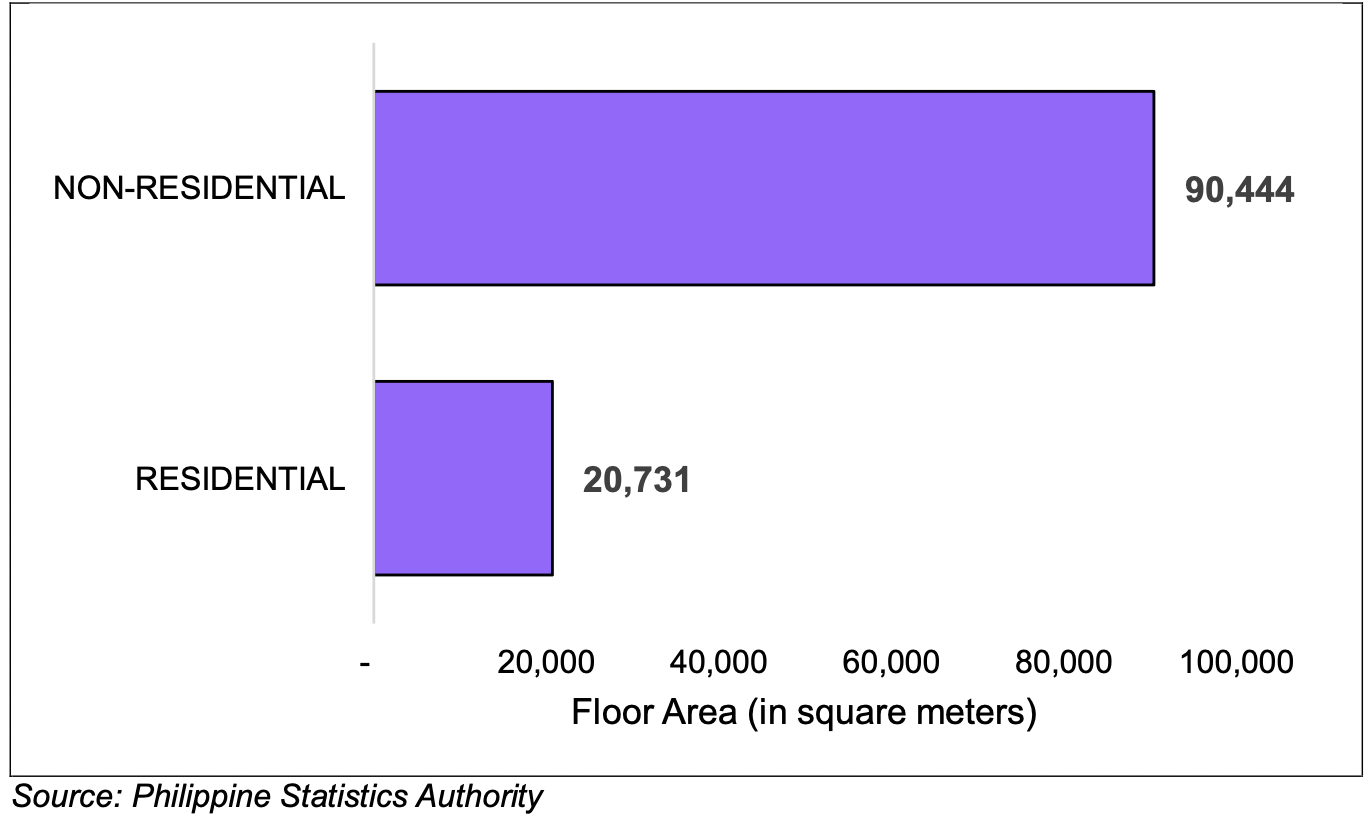
The reported total floor area of constructions in February 2025 was recorded at 111,175 square meters. This excludes alterations and repairs, other non-residential constructions such as facades, helipads, niches, water tanks, and similar structures, as well as other types of constructions like demolitions, street furniture, landscaping, and signboards, since no floor area was reported for these categories.
The total floor area in February 2025 increased more than 3.5 times compared to the 30,633 square meters recorded in February 2024. The floor area of approved constructions in Davao del Norte accounted for 43.6 percent of the 254.93 thousand square meters recorded in the Davao Region for the same period (Figure 2 and Table A).
Non-Residential Buildings accounted for 81.4 percent of total construction floor area
Non-residential constructions accounted for 90,444 square meters, or 81.4 percent of the total floor area of constructions in Davao del Norte in February 2025. This reflects an annual increase more than 4.5 times from the 19,682 square meters recorded in February 2024. Among non-residential constructions, industrial-type buildings had the largest floor area at 45,830 square meters, comprising 50.7 percent of the non-residential total (Figure 3 and Table A).
Figure 3. Floor Area of Constructions from Approved Building Permits for Residential and Non-Residential Buildings, Davao del Norte: February 2025
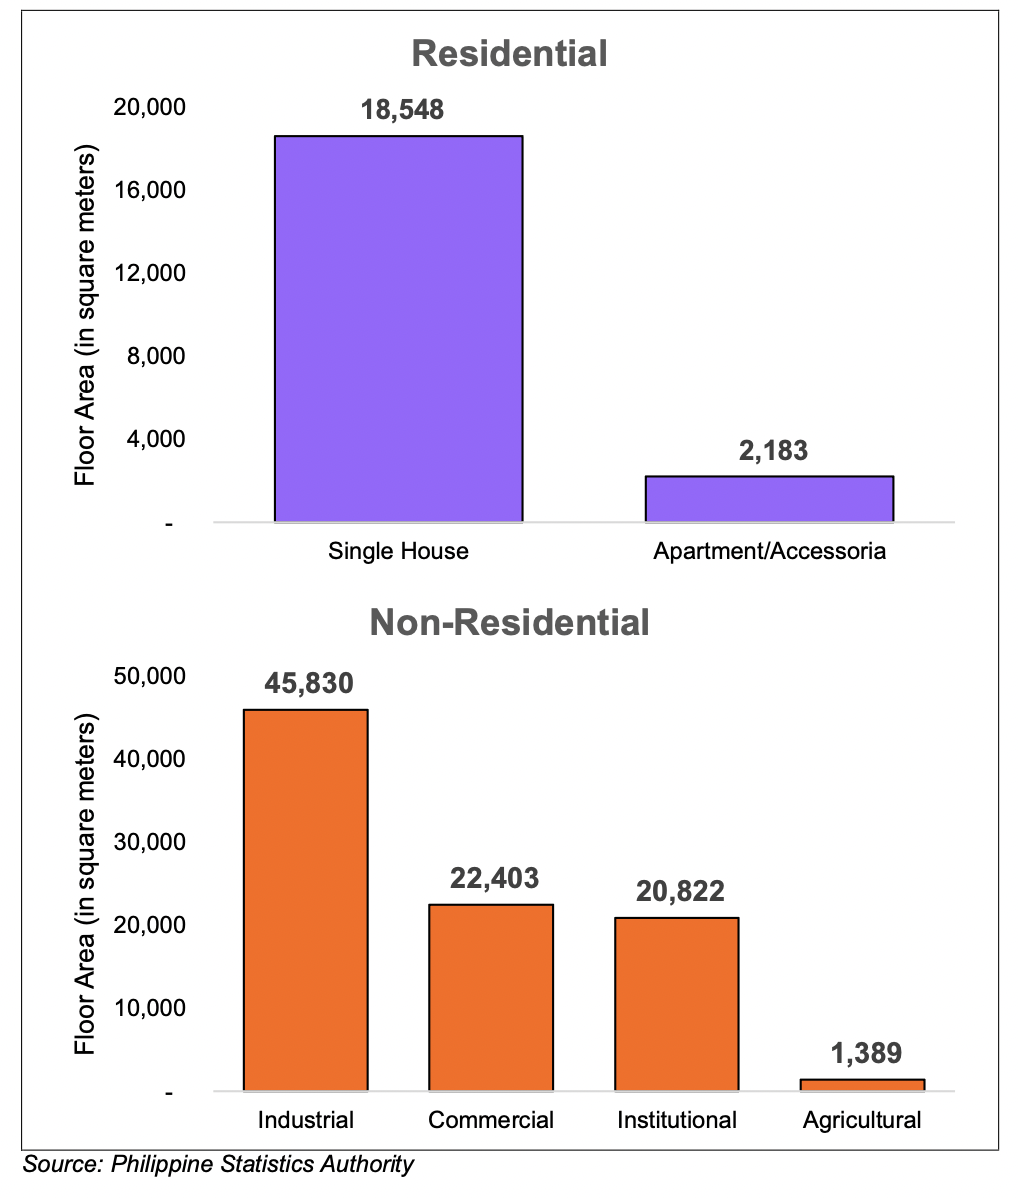
On the other hand, residential buildings recorded a total floor area of 20,731 square meters, or 18.6 percent of the total. This indicates an annual increase of 89.3 percent compared to the 10,951 square meters recorded in February 2024. Among residential constructions, single-type houses accounted for the highest floor area at 18,548 square meters, comprising 89.5 percent of the residential total (Figure 3 and Table A).
Non-Residential Buildings recorded the highest value of constructions
In February 2025, the total value of constructions in Davao del Norte amounted to PhP 481.52 million, indicating an annual increase more than double from the PhP 236.73 million recorded in February 2024 (Table A).
Figure 4. Value of Constructions from Approved Building Permits for Residential and Non-Residential Buildings, Davao del Norte: February 2025
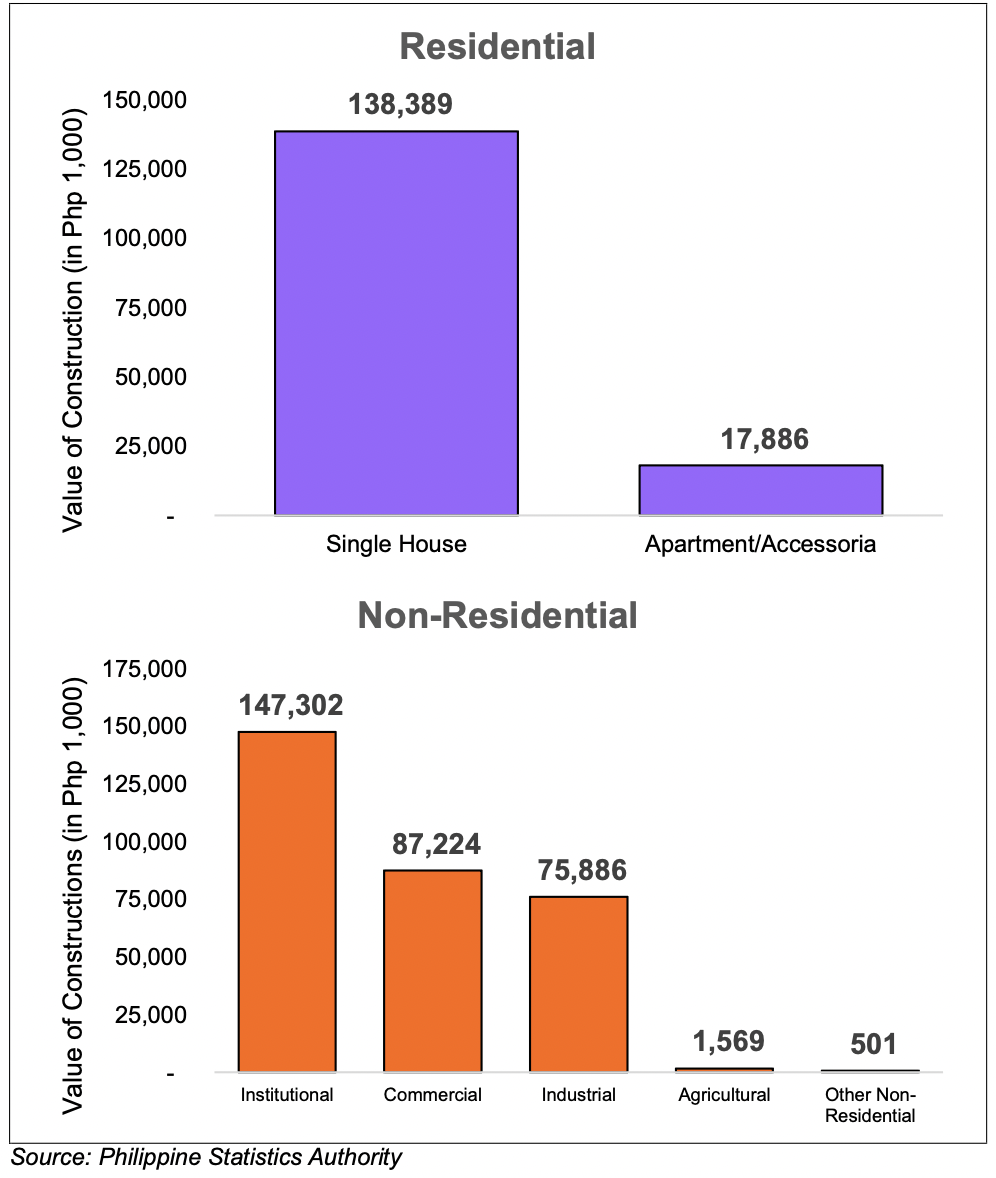
Non-residential building constructions, valued at PhP 312.48 million, accounted for 64.9 percent of the total construction value in the province for February 2025. This represents an annual increase two times from the PhP 133.57 million recorded in February 2024. Among non-residential constructions, institutional-type buildings had the highest value at PhP 147.30 million, comprising 47.1 percent of the non-residential total. (Figure 4 and Table A).
Meanwhile, the construction value of residential buildings amounted to PhP 156.28 million, or 32.5 percent of the total construction value registered in February 2025. This reflects an annual increase of 80.0 percent from the PhP 86.84 million reported in February 2024. Among residential constructions, single-type houses posted the highest value at PhP 138.39 million, accounting for 88.6 percent of the residential total (Figure 4 and Table A).
Apartments & Institutional-type Buildings recorded the highest average cost of Residential & Non-residential constructions
Figure 5. Average Cost per Square Meter for Residential and Non-residential Constructions, Davao del Norte: February 2025
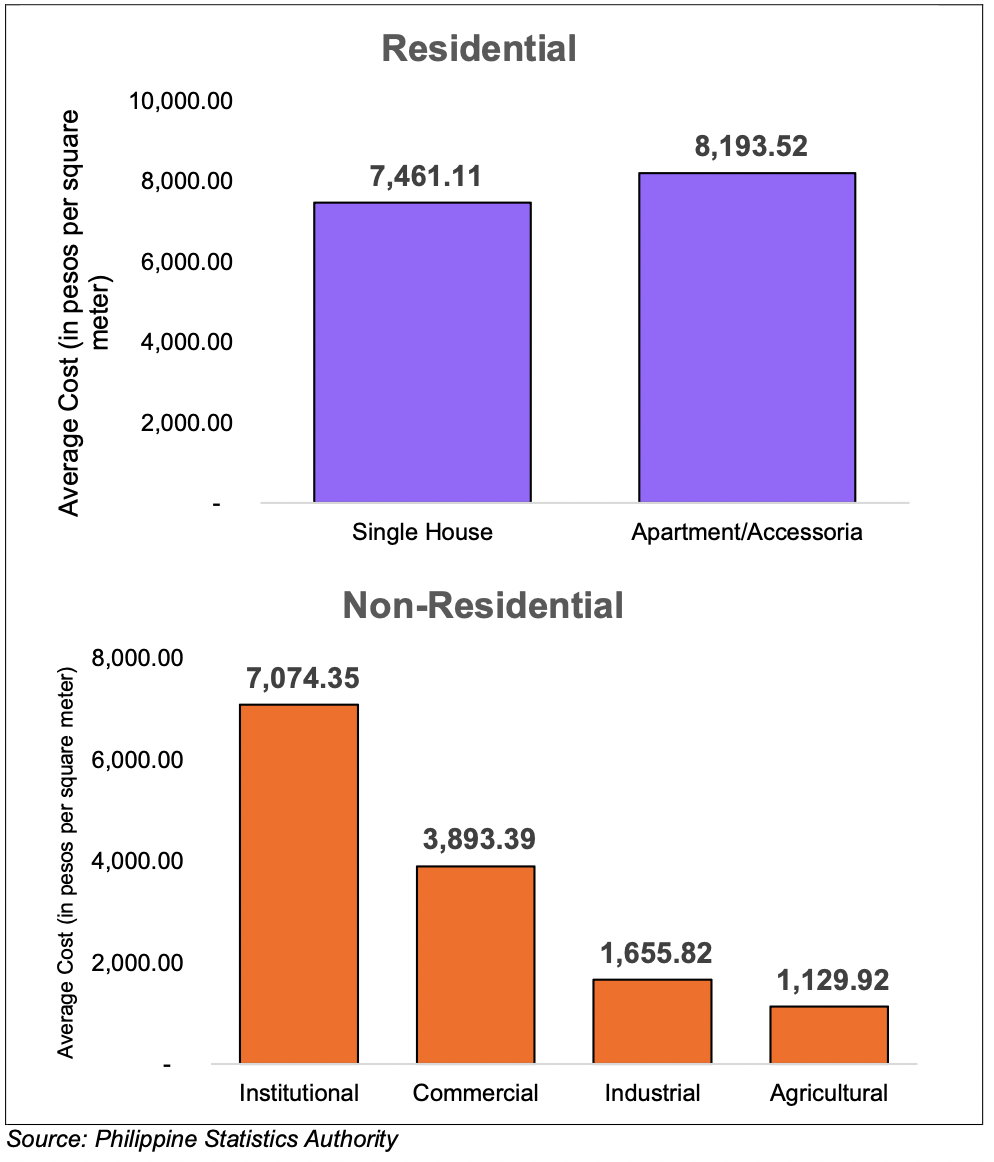
The average cost of constructions in February 2025 was recorded at PhP 4,281.72 per square meter. Alterations and repairs, other non-residential constructions such as facades, helipads, niches, water tanks, and similar structures, as well as other types of constructions including demolitions, street furniture, landscaping, and signboards, were excluded from the computation since no floor area was reported for these categories.
Among the types of constructions, residential buildings registered the highest average cost at PhP 7,538.23 per square meter in February 2025. Within residential constructions, apartment-type buildings reported the highest average cost at PhP 8,193.52 per square meter, while single-type house constructions recorded the lowest at PhP 7,461.11 per square meter.
For non-residential constructions, the province of Davao del Norte recorded an average cost of PhP 3,449.44 per square meter. Among non-residential types, institutional-type constructions posted the highest average cost at PhP 7,074.35 per square meter in February 2025, while agricultural-type constructions registered the lowest at PhP 1,129.92 per square meter (Figure 5 and Table A).
MICHELLE O. MANINGO
(Supervising Statistical Specialist)
Officer-in-Charge

MAA
| Attachment | Size |
|---|---|
|
|
608.44 KB |