
Release Date :
Reference Number :
2018-009
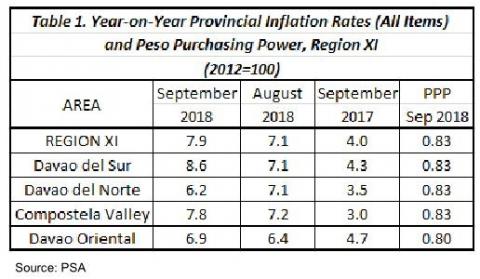 Davao Region’s inflation continued to move at a faster pace of 7.9 percent in September 2018. It was pegged at 7.1 percent in the previous month while 4.0 percent in the same month of last year. Among provinces, Davao del Norte displayed a slower rate at 6.2 percent while Davao del Sur showed the fastest at 8.6 percent. Purchasing power of peso in the region was at 83 centavos. It did the same with the provinces except for Davao Oriental which was at 80 centavos.
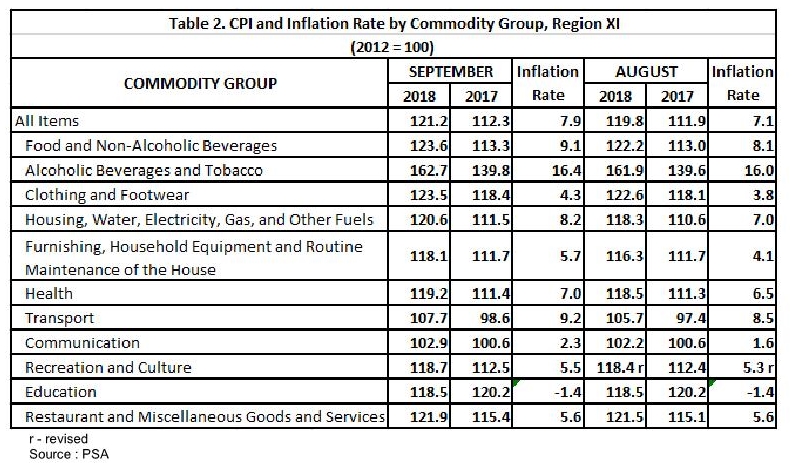
Meanwhile, the uptrend was primarily brought about by accelerated index in Furnishing, Household Equipment and Routine Maintenance of the House with 1.6 percentage points increase from 4.1 percent in the previous month to 5.7 percent in September 2018. Relatedly, annual rates were also higher in the indices of the following commodity groups with corresponding percentage points increase:
• Housing, Water, Electricity, Gas, and Other Fuels, 1.2;
• Food and Non-Alcoholic Beverages, 1.0;
• Transport, 0.7;
• Communication, 0.7;
• Health, 0.5;
• Clothing and Footwear, 0.5;
• Alcoholic Beverages and Tobacco, 0.4; and
• Recreation and Culture, 0.2.
On the other hand, Education and Restaurant and Miscellaneous Goods and Services retained its previous month’s rates at negative 1.4 percent and 5.6 percent, respectively
(see Table 2).
Moreover, among selected food items, annual increments were observed in Sugar, Jam, Honey, Chocolate and Confectionery (18.4%), Fish (14.3%), Rice (11.3%), Meat (10.2%), Bread and Cereals (9.1%), and Fruits (2.5%), while Corn and Vegetables decelerated to 3.9 percent and 2.4 percent, respectively (see Table 3).

RUBEN D. ABARO, JR.
OIC-Regional Director
| Attachment | Size |
|---|---|
|
|
529.56 KB |