
Release Date :
Reference Number :
SR-1125-2025-015
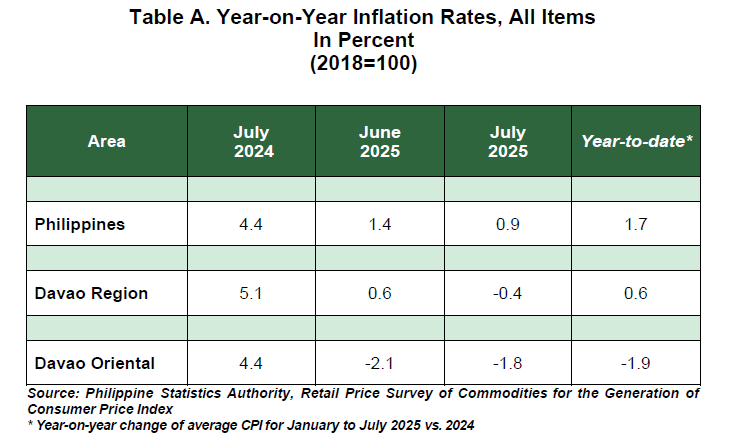
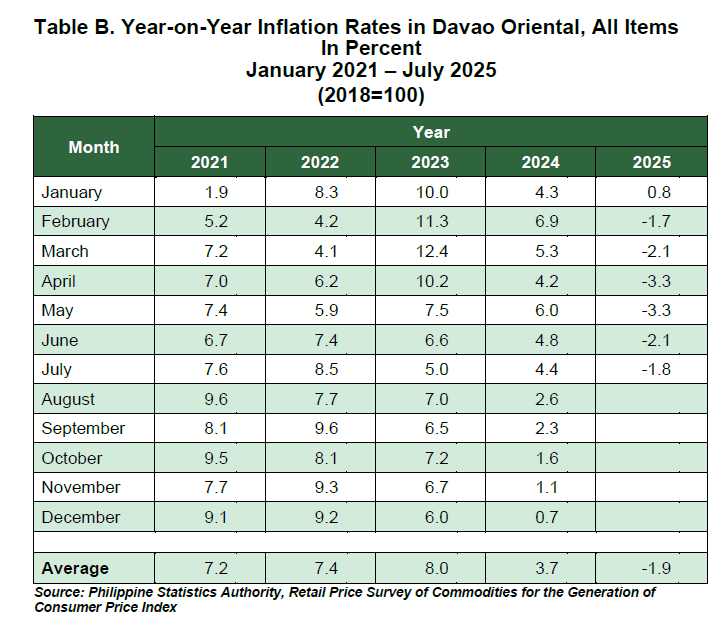
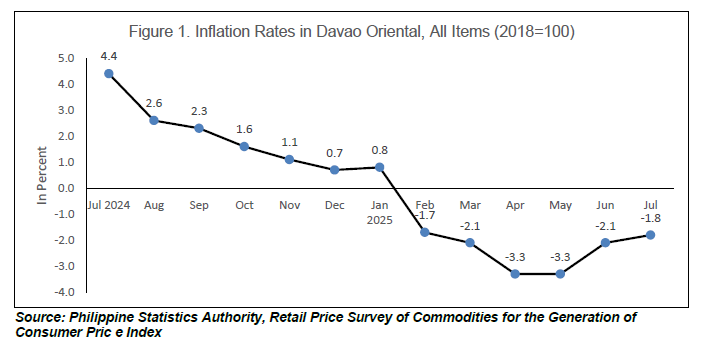
The inflation rate in Davao Oriental experienced growth this month, increasing to -1.8 percent, up from -2.1 percent in June 2025. This increase results in an average inflation rate of -1.9 percent for the province from January to July 2025. For comparison, the inflation rate in July 2024 was higher at 4.4 percent (as shown in Tables A and B and Figure 1).
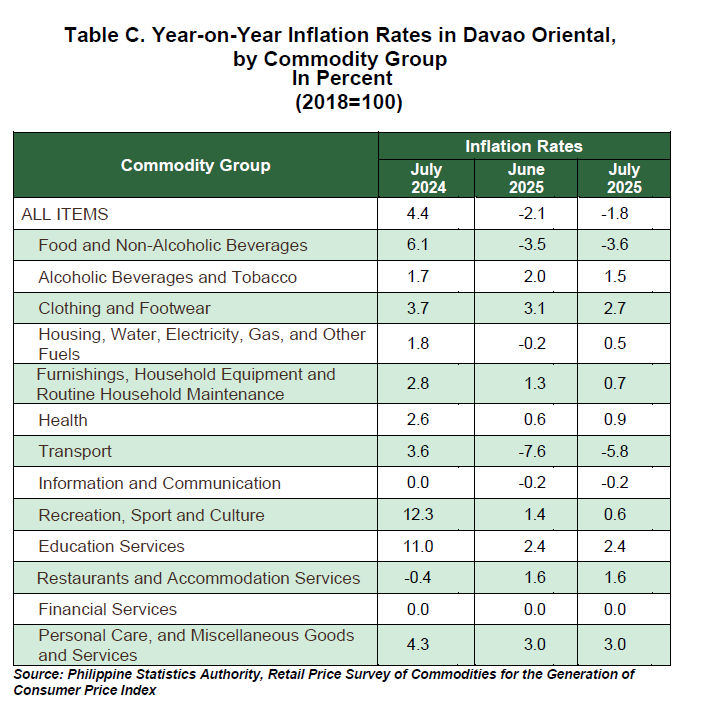
The recorded increase in the overall inflation in July 2025 was primarily influenced by the faster annual growth in the index of transport, which was -5.8 percent in July 2025 from -7.6 percent of the previous month. Another contributor to the increasing trend was housing, water, electricity, gas, and other fuels, which recorded an annual increase of 0.5 percent during the month, up from -0.2 percent in the previous month. Health also contributed, with an annual increase of 0.9 percent this month, rising from 0.6 percent in the previous month.
In contrast, lower annual increments were noted in the indices of the following commodity groups during the month:
a. Recreation, Sports and Culture, 0.6 percent from 1.4 percent;
b. Alcoholic Beverages and Tobacco, 1.5 percent from 2.0 percent;
c. Furnishings, Household Equipment and Routine Household Maintenance, 0.7 percent from 1.3 percent;
d. Clothing and Footwear, 2.7 percent from 3.1 percent; and
e. Food and Non-Alcoholic Beverages, -3.6 percent from -3.5 percent.
Meanwhile, indices on information and communication, education services, restaurant and accommodation services, financial services, and personal care, and miscellaneous goods and services retained their previous month’s annual rates. (as shown in Table C)
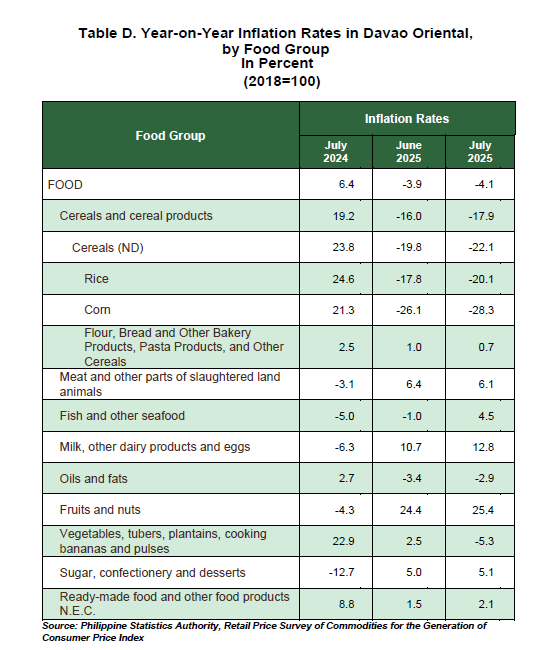
At the provincial level, food inflation decreased to -4.1 percent in July 2025 from -3.9 percent in the previous month. In July 2024, food inflation was higher at 6.4 percent. (as shown in Table D)
The deceleration of food inflation in July 2025 was primarily brought about by the slower inflation rate of vegetables, tubers, plantains, cooking bananas and pulses at -5.3 percent during the month from 2.5 percent in June 2025. This was followed by the faster year-on-year decline of cereals (ND) at -22.1 percent during the month from -19.8 percent in June 2025.
In addition, lower inflation rates during the month were also noted in the indices of the following food items:
a. Rice, -20.1 percent from -17.8 percent;
b. Corn, -28.3 percent from -26.1 percent;
c. Flour, Bread and Other Bakery Products, Pasta Products, and other Cereals, 0.7 percent from 1.0 percent; and
d. Meat and other parts of slaughtered land animals, 6.1 percent from 6.4 percent;
In contrast higher annual increments were noted in the indices of the following food groups during the month:
a. Fish and Other seafood, 4.5 percent from -1.0 percent;
b. Milk, Other Dairy Products, and Eggs, 12.8 percent from 10.7 percent;
c. Fruits and Nuts, 25.4 percent from 24.4 percent;
d. Ready-made food and other food products n.e.c, 2.1 percent from 1.5 percent;
e. Oils and Fats, -2.9 percent from -3.4 percent; and
f. Sugar, Confectionery, and Desserts, 5.1 percent from 5.0 percent.(as shown in Table D)
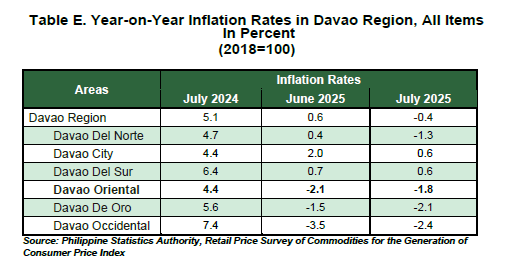
In July 2025, a mixed inflation trend was observed across all provinces and the highly urbanized city in the Davao Region, compared to June 2025. Davao Oriental, and Davao Occidental recorded high inflation rates, while Davao del Sur, Davao City, Davao de Oro and Davao del Norte recorded a lower inflation rate compared to the previous month. Davao Occidental reported the lowest inflation rate at -2.4 percent, whereas Davao City and Davao del Sur had the highest rate at 0.6 percent. (as shown in Table E).
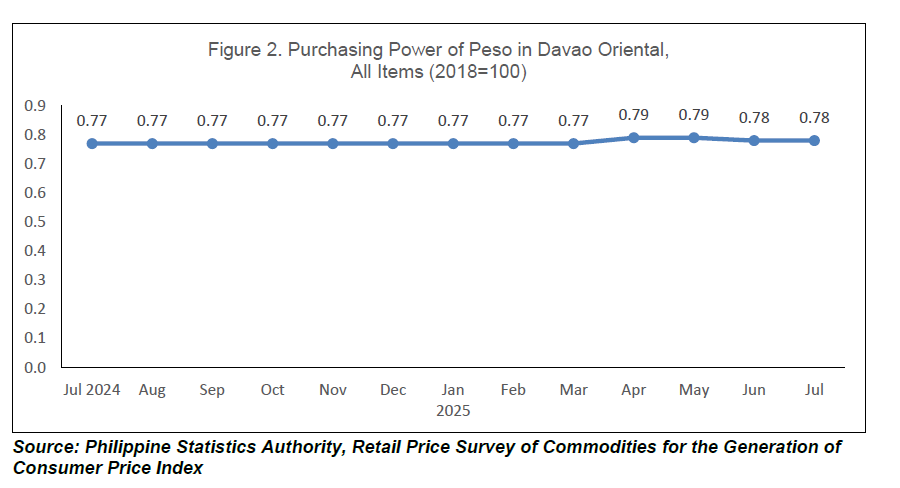
Purchasing Power of the Peso (PPP)
The purchasing power of the peso (PPP) shows how much the peso in the base year (2018) is worth in another period. It is computed by getting the reciprocal of the CPI and multiplying the result by 100.
As of July 2025, the purchasing power of the peso (PPP) in Davao Oriental remained at 0.78, indicating that PhP1.00 in 2018 is now equivalent to PhP0.78. The PPP was higher than in July 2024 at 0.77. (as shown in Figure 2)
TECHNICAL NOTES
Uses of CPI
The CPI is most widely used in the calculation of the inflation rate and purchasing power of peso. It is a major statistical series used for economic analysis and as a monitoring indicator of government economic policy.
Computation of CPI
The computation of the CPI involves consideration of the following important points:
a. Base Year/Period - A period, usually a year, at which the index number is set to 100. It is the reference point of the index number series.
b. Market Basket - A sample of the thousands of varieties of goods purchased for consumption and services availed by the households in the country selected to represent the composite price behavior of all goods and services purchased by consumers.
c. Weighting System - The weighting pattern uses the expenditures on various consumer items purchased by households as a proportion to total expenditure.
d. Formula - The formula used in computing the CPI is the weighted arithmetic mean of price relatives, the Laspeyre’s formula with a fixed base year period (2006) weights.
e. Geographic Coverage - CPI values are computed at the national, regional, and provincial levels, and for selected cities.
Note: CPIs and inflation rates by province and selected city are posted at the PSA website (https://openstat.psa.gov.ph/).
Approved for release:
EMILY P. TOMOGDAN
Chief Statistical Specialist
| Attachment | Size |
|---|---|
|
|
464.9 KB |