
Release Date :
Reference Number :
SRDDN2025-002
Summary Inflation Report: December 2024
Consumer Price Index for Bottom 30% Income Households: Davao del Norte
(2018=100)
Table A. Year-on-Year Inflation Rates for Bottom 30% Income Households in the Philippines, Region 11, and Davao del Norte: December 2023, | ||||
Area | December | November | December | Year-to-Date* |
Philippines | 5.0 | 2.9 | 2.5 | 4.2 |
Region 11 | 4.5 | 1.9 | 1.1 | 4.3 |
Davao del Norte | 1.0 | 1.2 | 1.4 | 2.6 |
Source: Retail Price Survey of Commodities for the Generation of Consumer Price Index Philippine Statistics Authority | ||||
Source: Retail Price Survey of Commodities for the Generation of Consumer Price Index Philippine Statistics Authority
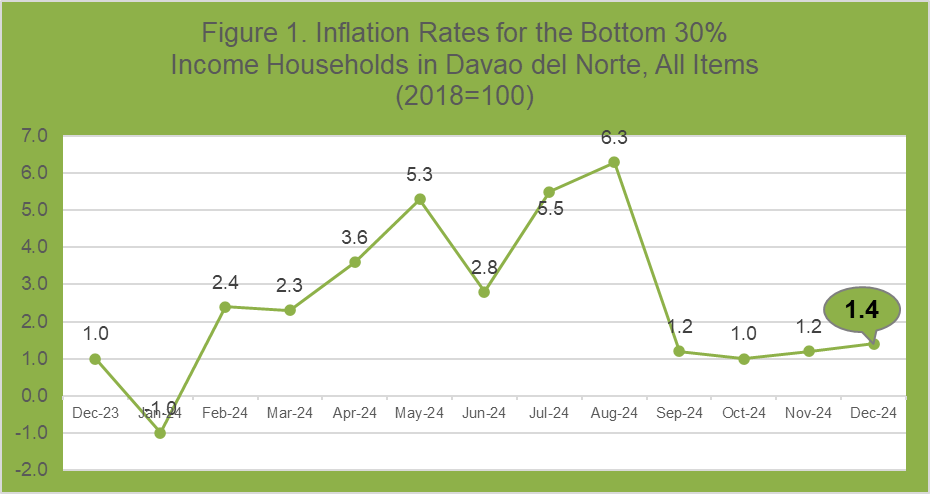
The inflation in Davao del Norte for bottom 30% income households increased by 0.4 percentage points in December 2024 (1.4%) compared to its inflation rate in the same month last year, which was recorded at 1.0 percent. The current inflation rate (1.4%) in the province is lower compared to the figure of the Philippines (2.5%) but higher compared to Davao Region which was recorded at 1.1 percent
(Table A).
| Year-on-Year Inflation Rates for Bottom 30% Income Households in Davao del Norte: January 2021 – December 2024 (All Items in Percent) | ||||
Month | 2021 | 2022 | 2023 | 2024 | |
January | 2.1 | 7.5 | 9.8 | -1.0 | |
February | 2.5 | 5.6 | 9.0 | 2.4 | |
March | 2.1 | 5.8 | 7.9 | 2.3 | |
April | 1.2 | 6.5 | 5.5 | 3.6 | |
May | 1.9 | 6.9 | 3.8 | 5.3 | |
June | 2.4 | 8.0 | 3.1 | 2.8 | |
July | 3.2 | 10.5 | 0.6 | 5.5 | |
August | 3.7 | 10.7 | -1.6 | 6.3 | |
September | 3.4 | 11.2 | 1.9 | 1.2 | |
October | 4.8 | 10.3 | 1.0 | 1.0 | |
November | 4.5 | 9.9 | 1.9 | 1.2 | |
December | 5.7 | 9.6 | 1.0 | 1.4 | |
Average | 3.1 | 8.5 | 3.6 | 2.6 | |
Source: Retail Price Survey of Commodities for the Generation of Consumer Price Index, Philippine Statistics Authority | |||||
2. Contribution to the Inflation
Table C showed that the December 2024 inflation for the bottom 30% income households in Davao del Norte was mostly contributed by the indices of food and non-alcoholic beverages (2.3%); personal care, and miscellaneous goods and services (1.8%); and alcoholic beverages and tobacco (2.2%).
Major Contributor to the Inflation in Davao del Norte: | ||||||
Commodity Group | December | November | December | Contribution to Inflation | ||
ALL ITEMS | 1.0 | 1.2 | 1.4 | 100.0 | ||
Food and non-alcoholic beverages | 8.2 | 2.7 | 2.3 | 95.9 | ||
Alcoholic beverages and tobacco | 12.3 | 2.2 | 2.2 | 3.0 | ||
Clothing and footwear | 7.8 | 0.6 | 0.5 | 0.8 | ||
Housing, water, electricity, gas and other fuels | (24.0) | (2.3) | (0.5) | (5.9) | ||
Furnishings, household equipment and routine household maintenance | 4.1 | 1.1 | 1.1 | 1.8 | ||
Health | (2.9) | (1.4) | (1.3) | (1.2) | ||
Transport | 4.7 | (3.7) | (0.7) | (3.7) | ||
Information and communication | 0.0 | 0.0 | 0.0 | 0.0 | ||
Recreation, sport and culture | 11.2 | 4.0 | 3.8 | 2.0 | ||
Education services | 3.2 | 1.0 | 1.0 | 0.2 | ||
Restaurants and accommodation services | 1.4 | 0.0 | 0.0 | 0.0 | ||
Financial services | 0.0 | (0.1) | (0.1) | (0.0) | ||
Personal care, and miscellaneous goods and services | 5.0 | 1.7 | 1.8 | 7.1 | ||
Source: Retail Price Survey of Commodities for the Generation of Consumer Price Index Philippine Statistics Authority
|
| |||||
3. Share to the Trend of Inflation
Table D. | Share to the Uptrend of Inflation in Davao del Norte: Bottom 30% income Households in Percent (2018=100) | ||||
Commodity Group | December | November | December | Share to Uptrend | |
ALL ITEMS | 1.0 | 1.2 | 1.4 | 100.0 | |
Food and non-alcoholic beverages | 8.2 | 2.7 | 2.3 |
| |
Alcoholic beverages and tobacco | 12.3 | 2.2 | 2.2 |
| |
Clothing and footwear | 7.8 | 0.6 | 0.5 |
| |
Housing, water, electricity, gas and other fuels | (24.0) | (2.3) | (0.5) | 56.5 | |
Furnishings, household equipment and routine household maintenance | 4.1 | 1.1 | 1.1 |
| |
Health | (2.9) | (1.4) | (1.3) | 0.2 | |
Transport | 4.7 | (3.7) | (0.7) | 42.2 | |
Information and communication | 0.0 | 0.0 | 0.0 |
| |
Recreation, sport and culture | 11.2 | 4.0 | 3.8 |
| |
Education services | 3.2 | 1.0 | 1.0 |
| |
Restaurants and accommodation services | 1.4 | 0.0 | 0.0 |
| |
Financial services | 0.0 | (0.1) | (0.1) |
| |
Personal care, and miscellaneous goods and services | 5.0 | 1.7 | 1.8 | 1.0 | |
Source: Retail Price Survey of Commodities for the Generation of Consumer Price Index Philippine Statistics Authority | |||||
The increment in the inflation rate of the bottom 30% income households in Davao del Norte can be observed with its upward trend from 1.2 percent in November 2024 to 1.4 percent in December 2024. This trend was mainly contributed by the slower annual decrease of the price indices for housing, water, electricity, gas and other fuels from a rate of -2.3 percent in November 2024 to -0.5 percent in December 2024 and was followed by the index of transport (from -3.7% to -0.7%). Also contributing to this trend is the faster price increase in the price index for personal care, and miscellaneous goods and services with
1.8 percent from 1.7 percent in November 2024 (Table D).
It can also be observed that the following commodities has shown no sign of increase nor decrease in inflation rate compared to their corresponding rates in November 2024:
Alcoholic beverages and tobacco (2.2%);
Furnishings, household equipment and routine household maintenance (1.1%);
Information and communication (0.0%);
Education services (1.0%);
Restaurants and accommodation services (0.0%); and
Financial services (-0.1%).
The bottom 30% income households inflation rate of the index for food has shown a downward trend from an inflation rate of 2.9 percent in November 2024 to
2.6 percent in December 2025. The trend of the food inflation was mostly attributed by the slower annual increase in the index for rice which recorded an inflation rate of 1.2 percent in December 2024 from a rate of 3.2 percent in November 2024. This was followed by the indices for ready-made food and other food products not elsewhere classified (from 3.5% to 2.4%); and meat and other parts of slaughtered land animals (from 2.0% to 1.9%) (Table E.)
Table E. | Share to the Trend of Food Inflation in Davao del Norte: Bottom 30% Income Households in Percent (2018=100) | ||||
|---|---|---|---|---|---|
Commodity Group | December | November | December | Share to Downtrend | |
FOOD | 8.6 | 2.9 | 2.6 | 100.0 | |
Rice | 23.6 | 3.2 | 1.2 | 54.5 | |
Corn | 2.3 | 5.1 | (6.0) | 39.3 | |
Flour, Bread and Other Bakery Products, Pasta Products, And Other Cereals | 7.7 | 2.9 | 2.6 | 0.0 | |
Meat and other parts of slaughtered land animals | (0.3) | 2.0 | 1.9 | 1.0 | |
Fish and other seafood | 6.7 | 1.8 | 4.8 | ||
Milk, other dairy products and eggs | 2.6 | 5.5 | 6.6 | ||
Oils and fats | 3.2 | (4.4) | (4.4) | ||
Fruits and nuts | 24.9 | 5.1 | 8.3 |
| |
Vegetables, tubers, plantains, cooking bananas and pulses | (3.5) | 4.2 | 6.1 |
| |
Sugar, confectionery and desserts | (8.3) | (1.1) | 0.1 |
| |
Ready-made food and other food products n.e.c. | 3.8 | 3.5 | 2.4 | 2.3 | |
Source: Retail Price Survey of Commodities for the Generation of Consumer Price Index Philippine Statistics Authority | |||||
Approved for Release:
PEPITO D. AMOYEN
Chief Statistical Specialist
| Attachment | Size |
|---|---|
|
|
770.05 KB |