
Release Date :
Reference Number :
SRDDN2025-022
SPECIAL RELEASE
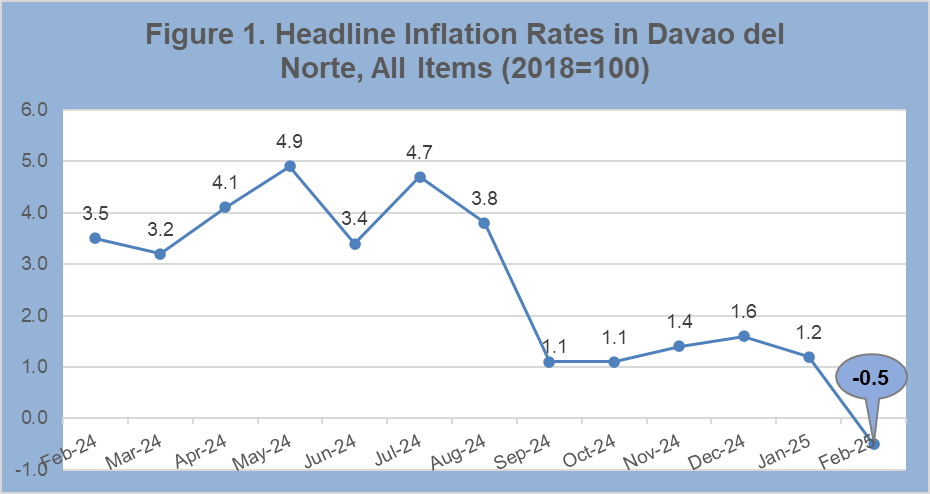
Inflation rate of Davao del Norte decreased by 1.7 percentage points (2018=100) in February 2025
Table A. Year-on-Year Inflation Rates: All Items in Percent Philippines, Region 11, and Davao del Norte February 2024, January – February 2025 | ||||
Area | February | January | February | Year-to-Date* |
Philippines | 3.4 | 2.9 | 2.1 | 2.5 |
Region 11 | 4.8 | 2.1 | 0.6 | 1.4 |
Davao del Norte | 3.5 | 1.2 | (0.5) | 0.4 |
Source: Retail Price Survey of Commodities for the Generation of Consumer Price Index Philippine Statistics Authority | ||||
1. Inflation in Davao del Norte
The headline inflation of Davao del Norte decreased by 4 percentage points in February 2025 (-0.5%) compared to its inflation rate in the same month last year, which was recorded at 3.5 percent. The current inflation rate (-0.5%) of the province is lower compared to the headline inflation of the Philippines and Davao Region which was recorded at 2.1 percent and 0.6 percent, respectively (Table A).
The average inflation of Davao del Norte for the year 2025 stood at 0.4 percent (Table B).
Table B. Year-on-Year Inflation Rates in Davao del Norte: All Items in Percent January 2022 – February 2025 | ||||
Month | 2022 | 2023 | 2024 | 2025 |
January | 5.6 | 6.9 | 1.0 | 1.2 |
February | 3.9 | 6.5 | 3.5 | -0.5 |
March | 4.0 | 6.0 | 3.2 |
|
April | 4.7 | 4.2 | 4.1 |
|
May | 4.7 | 3.1 | 4.9 |
|
June | 5.7 | 2.5 | 3.4 |
|
July | 7.1 | 1.3 | 4.7 |
|
August | 6.9 | 1.6 | 3.8 |
|
September | 7.4 | 3.4 | 1.1 |
|
October | 7.2 | 2.8 | 1.1 |
|
November | 7.0 | 3.2 | 1.4 |
|
December | 6.6 | 2.9 | 1.6 |
|
Average | 5.9 | 3.7 | 2.8 | 0.4 |
Source: Retail Price Survey of Commodities for the Generation of Consumer Price Index, Philippine Statistics Authority | ||||
2. Contribution to the Inflation
Table C showed that the February 2025 inflation of Davao del Norte was mostly contributed by the indices of food and non-alcoholic beverages (-1.5%); transport (-1.9%); and restaurants and accommodation services (-0.1%).
Table C. Major Contributor to the Inflation in Davao del Norte: |
| ||||
Commodity Group | February | January | February | Contribution to Inflation | |
ALL ITEMS | 3.5 | 1.2 | (0.5) | 100.0 | |
Food and non-alcoholic beverages | 7.2 | 1.6 | (1.5) | 146.8 | |
Alcoholic beverages and tobacco | 12.6 | 4.3 | 5.3 | (21.2) | |
Clothing and footwear | 5.2 | 0.3 | 0.4 | (2.4) | |
Housing, water, electricity, gas and other fuels | (7.2) | 1.0 | 0.2 | (7.7) | |
Furnishings, household equipment and routine household maintenance | 5.0 | 4.1 | 3.9 | (20.0) | |
Health | 2.9 | 2.7 | 2.3 | (11.5) | |
Transport | 4.0 | (0.8) | (1.9) | 41.0 | |
Information and communication | 0.3 | 0.0 | 0.0 | 0.0 | |
Recreation, sport and culture | 3.7 | 1.7 | 1.8 | (2.5) | |
Education services | 4.6 | 0.4 | 0.4 | (1.0) | |
Restaurants and accommodation services | 1.4 | (0.1) | (0.1) | 1.3 | |
Financial services | (0.1) | 0.0 | 0.0 | 0.0 | |
Personal care, and miscellaneous goods and services | 4.0 | 2.4 | 2.6 | (22.7) | |
Source: Retail Price Survey of Commodities for the Generation of Consumer Price Index Philippine Statistics Authority
|
| ||||
3. Share to the Trend of Inflation
Table D. Share to the Downtrend of Inflation in Davao del Norte: All income Households in Percent (2018=100) | ||||
Commodity Group | February | January | February | Share to Downtrend |
ALL ITEMS | 3.5 | 1.2 | (0.5) | 100.0 |
Food and non-alcoholic beverages | 7.2 | 1.6 | (1.5) | 84.0 |
Alcoholic beverages and tobacco | 12.6 | 4.3 | 5.3 |
|
Clothing and footwear | 5.2 | 0.3 | 0.4 |
|
Housing, water, electricity, gas and other fuels | (7.2) | 1.0 | 0.2 | 8.6 |
Furnishings, household equipment and routine household maintenance | 5.0 | 4.1 | 3.9 | 0.3 |
Health | 2.9 | 2.7 | 2.3 | 0.6 |
Transport | 4.0 | (0.8) | (1.9) | 6.6 |
Information and communication | 0.3 | 0.0 | 0.0 |
|
Recreation, sport and culture | 3.7 | 1.7 | 1.8 |
|
Education services | 4.6 | 0.4 | 0.4 |
|
Restaurants and accommodation services | 1.4 | (0.1) | (0.1) |
|
Financial services | (0.1) | 0.0 | 0.0 |
|
Personal care, and miscellaneous goods and services | 4.0 | 2.4 | 2.6 |
|
Source: Retail Price Survey of Commodities for the Generation of Consumer Price Index Philippine Statistics Authority | ||||
The decrement in the inflation rate of Davao del Norte can be observed with its downward trend from 1.2 percent in January 2025 to -0.5 percent in February 2025. This trend is mainly contributed by the annual price decrease of food and non-alcoholic beverages; and transport with a recorded inflation rate of
-1.5 percent and -1.9 percent, respectively. Also contributing to this trend is the slower annual price increase of housing, water, electricity, gas and other fuels (from 1.0% to 0.2%). (Table D).
Despite the decrease in the inflation rate of province, an upward trend in February 2025 compared to their corresponding rates in January 2025 can be observed in Table D for the following commodities:
Alcoholic beverages and tobacco (from 4.3% to 5.3%);
Clothing and footwear (from 0.3% to 0.4%);
Recreation, sport and culture (from 1.7% to 1.8%); and
Personal care, and miscellaneous goods and services (from 2.4% to 2.6%).
It can also be observed that the following commodities has shown no sign of increase nor decrease in inflation rate in comparison to their corresponding rates in the last month:
Information and communication (0.0%);
Education services (0.4%);
Restaurants and accommodation services (-0.1%); and
Financial services (0.0%).
The inflation of the index for food decreased from 1.7% in January 2025 to -2.0% in February 2025. The downtrend of the food inflation was mostly attributed by the annual price decrease of vegetables, tubers, plantains, cooking bananas and pulses; and rice. Also contributing to this trend is the slower annual price increase of fish and other seafood (Table E).
Table E. Share to the Downtrend of Food Inflation in Davao del Norte: All income Households in Percent (2018=100) | ||||
|---|---|---|---|---|
Commodity Group | February | January | February | Share to |
FOOD | 7.7 | 1.7 | (2.0) | 100.0 |
Rice | 24.1 | (2.8) | (5.0) | 21.0 |
Corn | (2.5) | (11.5) | (12.2) | 0.6 |
Flour, Bread and Other Bakery Products, Pasta Products, And Other Cereals | 7.6 | 2.2 | 1.3 | 3.6 |
Meat and other parts of slaughtered land animals | (1.4) | 2.4 | 2.4 |
|
Fish and other seafood | 5.0 | 2.4 | 0.7 | 9.2 |
Milk, other dairy products and eggs | 1.9 | 3.8 | 2.6 | 3.0 |
Oils and fats | (2.5) | (3.1) | (0.7) |
|
Fruits and nuts | 18.8 | 6.9 | 0.5 | 6.8 |
Vegetables, tubers, plantains, cooking bananas and pulses | 3.5 | 11.7 | (14.0) | 54.8 |
Sugar, confectionery and desserts | (3.4) | (1.0) | (2.6) | 1.2 |
Ready-made food and other food products n.e.c. | 5.3 | 4.1 | 5.0 |
|
Source: Retail Price Survey of Commodities for the Generation of Consumer Price Index Philippine Statistics Authority | ||||
4. Davao del Norte’s Inflation Rate vis-à-vis other Provinces of Davao Region
Table F. Inflation Rate by Province for All Income Households: | ||||
|---|---|---|---|---|
Area Name | February | January | February | Trend |
Davao Region | 4.8 | 2.1 | 0.6 | Down |
DAVAO DEL NORTE | 3.5 | 1.2 | (0.5) | Down |
DAVAO CITY | 4.4 | 2.7 | 1.8 | Down |
DAVAO DEL SUR | 6.4 | 3.0 | 0.7 | Down |
DAVAO ORIENTAL | 6.9 | 0.8 | (1.7) | Down |
DAVAO DE ORO | 4.9 | 0.8 | (1.2) | Down |
DAVAO OCCIDENTAL | 7.0 | 1.6 | (0.3) | Down |
Source: Retail Price Survey of Commodities for the Generation of Consumer Price Index Philippine Statistics Authority | ||||
Among the five provinces and one HUC of Davao Region, Davao Oriental has the slowest recorded inflation rate in February 2025 with -1.7 percent. This was followed by Davao de Oro (-1.2%), Davao del Norte (-0.5%), Davao Occidental (-0.3%),
Davao del Sur (0.7%), and Davao City (1.8%) (Table F).
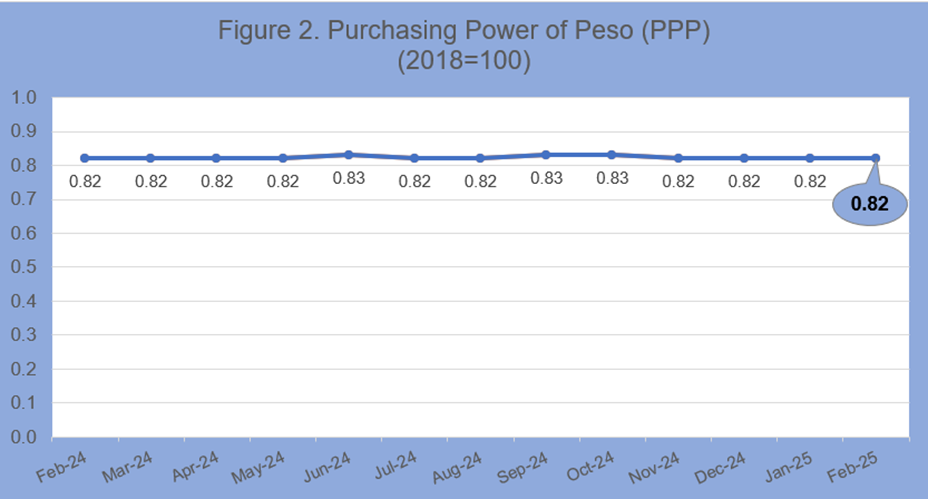
5. Purchasing Power of Peso
The Purchasing Power of Peso (PPP) measures the current value of the peso in reference to its value in the base year. It has an inverse relationship with the Consumer Price Index (CPI) which means that if the CPI increases, the PPP decreases.
Figure 2 showed that the PPP for the province of Davao del Norte steadied and was recorded at 0.82 from November 2024 to February 2025. This suggests that Php100.00 in 2018 is currently valued at PhP82.00.
Technical Notes Consumer Price Index (CPI). An indicator of the change in the average retail prices of a fixed basket of goods and services commonly purchased by households relative to a base year. Based Period. A reference date at which the index is equal to 100. The Base year is 2018. Inflation Rate. The rate of change of the CPI expressed in percent. It is interpreted in terms of declining purchasing power of peso. Purchasing Power of Peso. The measure of how much the peso in the base period is worth in the current period. Note: Consumer Price Indices (CPI) and inflation rates by province and selected cities are posted at the PSA website (https://openstat.psa.gov.ph/).
|

| Attachment | Size |
|---|---|
|
|
590.39 KB |