
Release Date :
Reference Number :
SRDDN2025-026
Summary Inflation Report: March 2025
Consumer Price Index for Bottom 30% Income Households: Davao del Norte
(2018=100)
Table A. Year-on-Year Inflation Rates for Bottom 30% Income Households in the Philippines, Region 11, and Davao del Norte: March 2024, | ||||
Area | March | February | March | Year-to-Date* |
Philippines | 4.6 | 1.5 | 1.1 | 1.7 |
Region 11 | 5.3 | (1.5) | (1.6) | -0.8 |
Davao del Norte | 2.3 | (1.7) | (0.9) | -0.6 |
Source: Retail Price Survey of Commodities for the Generation of Consumer Price Index Philippine Statistics Authority | ||||
1. Inflation in Davao del Norte
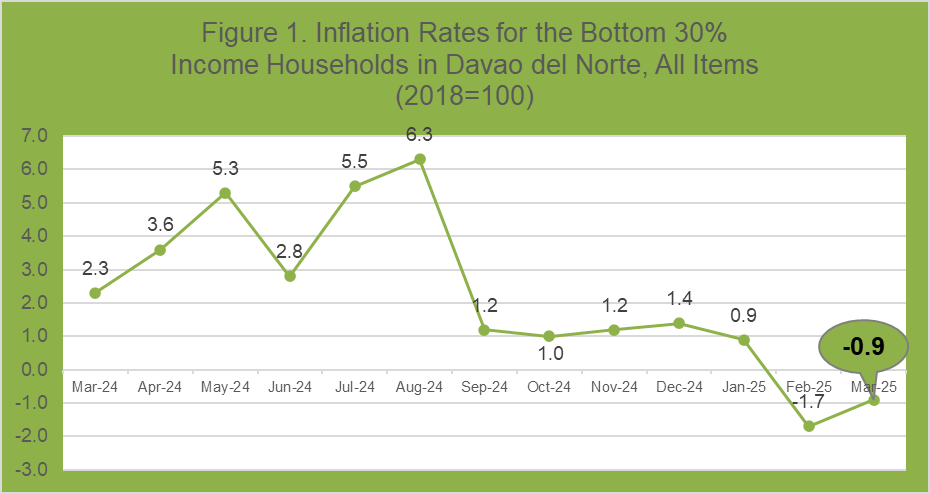
The inflation in Davao del Norte for bottom 30% income households decreased by 3.2 percentage points in March 2025 (-0.9%) compared to its inflation rate in the same month last year, which was recorded at 2.3 percent. The current inflation rate (-0.9%) in the province is lower compared to the figure of the Philippines which was recorded at 1.1 percent but higher than the Davao Region’s figure with -1.6 percent (Table A).
| Year-on-Year Inflation Rates for Bottom 30% Income Households in Davao del Norte: January 2022 – March 2025 (All Items in Percent) | ||||
Month | 2022 | 2023 | 2024 | 2025 | |
January | 7.5 | 9.8 | -1.0 | 0.9 | |
February | 5.6 | 9.0 | 2.4 | -1.7 | |
March | 5.8 | 7.9 | 2.3 | -0.9 | |
April | 6.5 | 5.5 | 3.6 |
| |
May | 6.9 | 3.8 | 5.3 |
| |
June | 8.0 | 3.1 | 2.8 |
| |
July | 10.5 | 0.6 | 5.5 |
| |
August | 10.7 | -1.6 | 6.3 |
| |
September | 11.2 | 1.9 | 1.2 |
| |
October | 10.3 | 1.0 | 1.0 |
| |
November | 9.9 | 1.9 | 1.2 |
| |
December | 9.6 | 1.0 | 1.4 |
| |
Average | 8.5 | 3.6 | 2.6 | -0.6 | |
Source: Retail Price Survey of Commodities for the Generation of Consumer Price Index, Philippine Statistics Authority | |||||
2. Contribution to the Inflation
Table C showed that the March 2025 inflation for the bottom 30% income households in Davao del Norte was mostly contributed by the indices of food and non-alcoholic beverages (-1.9%); housing, electricity, gas and other fuels (-0.8%); and transport (-2.1%).
Major Contributor to the Inflation in Davao del Norte: | ||||||
Commodity Group | March | February | March | Contribution to Inflation | ||
ALL ITEMS | 2.3 | (1.7) | (0.9) | 100.0 | ||
Food and non-alcoholic beverages | 8.8 | (2.6) | (1.9) | 122.3 | ||
Alcoholic beverages and tobacco | 10.7 | 6.7 | 7.5 | (24.1) | ||
Clothing and footwear | 7.4 | 0.7 | 1.2 | (2.8) | ||
Housing, water, electricity, gas and other fuels | (20.4) | (3.3) | (0.8) | 11.6 | ||
Furnishings, household equipment and routine household maintenance | 3.6 | 1.6 | 1.9 | (4.6) | ||
Health | (3.4) | (1.1) | (0.6) | 0.9 | ||
Transport | 3.6 | (1.9) | (2.1) | 18.2 | ||
Information and communication | 0.0 | 0.0 | 0.0 | 0.0 | ||
Recreation, sport and culture | 9.7 | 3.8 | 4.4 | (3.9) | ||
Education services | 3.2 | 1.0 | 1.0 | (0.3) | ||
Restaurants and accommodation services | 1.4 | 0.0 | 0.0 | 0.0 | ||
Financial services | (0.1) | 0.0 | 0.0 | 0.0 | ||
Personal care, and miscellaneous goods and services | 3.8 | 2.7 | 3.0 | (17.3) | ||
Source: Retail Price Survey of Commodities for the Generation of Consumer Price Index Philippine Statistics Authority
|
| |||||
3. Share to the Trend of Inflation
Table D. | Share to the Uptrend of Inflation in Davao del Norte: Bottom 30% income Households in Percent (2018=100) | ||||
Commodity Group | March | February | March | Share to Uptrend | |
ALL ITEMS | 2.3 | (1.7) | (0.9) | 100.0 | |
Food and non-alcoholic beverages | 8.8 | (2.6) | (1.9) | 46.1 | |
Alcoholic beverages and tobacco | 10.7 | 6.7 | 7.5 | 1.7 | |
Clothing and footwear | 7.4 | 0.7 | 1.2 | 1.3 | |
Housing, water, electricity, gas and other fuels | (20.4) | (3.3) | (0.8) | 47.0 | |
Furnishings, household equipment and routine household maintenance | 3.6 | 1.6 | 1.9 | 0.8 | |
Health | (3.4) | (1.1) | (0.6) | 0.7 | |
Transport | 3.6 | (1.9) | (2.1) |
| |
Information and communication | 0.0 | 0.0 | 0.0 |
| |
Recreation, sport and culture | 9.7 | 3.8 | 4.4 | 0.5 | |
Education services | 3.2 | 1.0 | 1.0 |
| |
Restaurants and accommodation services | 1.4 | 0.0 | 0.0 |
| |
Financial services | (0.1) | 0.0 | 0.0 |
| |
Personal care, and miscellaneous goods and services | 3.8 | 2.7 | 3.0 | 1.9 | |
Source: Retail Price Survey of Commodities for the Generation of Consumer Price Index Philippine Statistics Authority | |||||
The increment in the inflation rate of the bottom 30% income households in Davao del Norte can be observed with its upward trend from -1.7 percent in February 2025 to -0.9 percent in March 2025. This trend was mainly contributed by the slower annual price decrease of housing, water, electricity, gas and other fuels (-0.8%), and food and non-alcoholic beverages (-1.9%). Also contributing to this trend is the faster price increase of personal care, and miscellaneous goods and services (3.0%) (Table D).
Despite the increase in the inflation rate of the province, the commodity group for transport has exhibited a decrease in inflation rate in March 2025 with -2.1 percent.
It can also be observed that the following commodities has shown no sign of increase nor decrease in inflation rate compared to their corresponding rates in February 2025:
Information and communication (0.0%);
Education services (1.0%);
Restaurants and accommodation services (0.0%); and
Financial services (0.0%).
The bottom 30% income households inflation rate of the index for food has shown an upward trend from an inflation rate of -3.0 percent in February 2025 to
-2.3 percent in March 2025. The trend of the food inflation was mostly attributed by the slower annual price decrease of vegetables, tubers, plantains, cooking bananas and pulses (-5.9%), and the faster price increase of meat and other parts of slaughtered land animals (4.3%), and fish and other seafood (2.2%) (Table E).
Table E. | Share to the Trend of Food Inflation in Davao del Norte: Bottom 30% Income Households in Percent (2018=100) | ||||
|---|---|---|---|---|---|
Commodity Group | March | February | March | Share to Uptrend | |
FOOD | 9.3 | (3.0) | (2.3) | 100.0 | |
Rice | 29.0 | (5.4) | (7.5) |
| |
Corn | (2.7) | (12.2) | (16.2) |
| |
Flour, Bread and Other Bakery Products, Pasta Products, And Other Cereals | 7.6 | 1.7 | 1.7 | 0.0 | |
Meat and other parts of slaughtered land animals | (2.2) | 2.3 | 4.3 | 19.3 | |
Fish and other seafood | 0.5 | (1.0) | 2.2 | 36.9 | |
Milk, other dairy products and eggs | 0.5 | 5.4 | 6.4 | 5.0 | |
Oils and fats | (2.2) | (2.3) | (0.8) | 1.5 | |
Fruits and nuts | 29.4 | (0.5) | (4.1) |
| |
Vegetables, tubers, plantains, cooking bananas and pulses | 5.6 | (13.7) | (5.9) | 37.4 | |
Sugar, confectionery and desserts | 1.6 | (4.2) | (5.5) |
| |
Ready-made food and other food products n.e.c. | 6.2 | 4.8 | 4.3 |
| |
Source: Retail Price Survey of Commodities for the Generation of Consumer Price Index Philippine Statistics Authority | |||||

| Attachment | Size |
|---|---|
|
|
375.14 KB |