
Release Date :
Reference Number :
2022-013
The Philippine Statistics Authority - Regional Statistical Services Office 11 (PSA RSSO 11) is committed to fulfilling its vision to be a solid, responsive, and world-class authority on quality statistics and civil registration and mission to deliver relevant, reliable statistics and efficient civil registration services. PSA RSSO 11 conducts a quarterly Customer Satisfaction Survey to the clients of PSA Civil Registration Serbilis (CRS) Outlet in Davao City to continually improve the delivery of its frontline services and meet customer expectations.
Customer Satisfaction Survey (CSS) measures a person's perceived satisfaction with a product or service (Milner & Furnham, 2017). It is an effective tool for monitoring, reporting, and tracking the performance of the organization to provide specific actionable information to improve services and customer satisfaction (Hill, Roche, & Allen, 2007, p.7).
The survey was conducted daily last 07 to 11 March 2022 distributed at varying time intervals. A total of 106 randomly selected walk-in clients were surveyed and accomplished the self-administered questionnaires. This survey primarily aims to determine the customers' overall satisfaction level of the services of CRS Serbilis Outlet - Davao. Specifically, the survey intends to:
1. Determine the demographic profile of surveyed transacting clients;
2. Assess the overall satisfaction of the respondents concerning: promptness and responsiveness of the service; grooming, courteousness, and knowledge of the employees; clarity and simplicity of the procedures; and cleanliness, safety, and level of comfort and ventilation of the area and facilities;
3.Identify the familiarity of existing alternative options in securing Civil Registry Documents (CRDs); and
4.Assess the feedbacks, commendations, and suggestions as basis for actionable improvements.
Highlights of the Results of the First Quarter 2022 Customer Satisfaction Survey
Demographic Profile of the Respondents
The surveyed clients were predominantly composed of female respondents with 57.5 percent while 42.5 percent were male.
For educational attainment, the majority of the respondents reported having reached college or higher with 63.2 percent followed by high school with 35.8 percent. On the other hand, the least reported educational attainment was elementary with 0.9 percent.
Majority of the respondents were unemployed with 57.5 percent while 42.5 percent were employed.
Most of the respondents reside within Davao City with 80.2 percent while clients residing outside Davao City comprised of 19.8 percent.
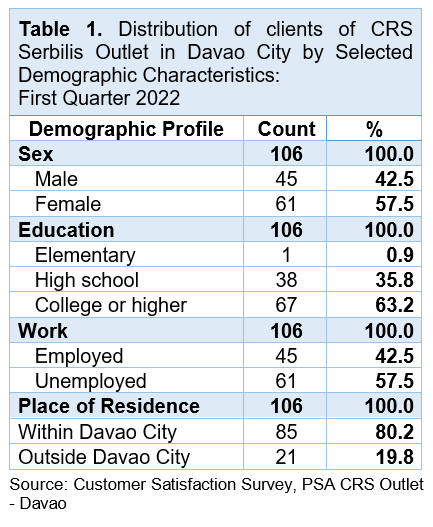
Figure 1 displays the distribution of the place of origin of clients that are residing outside Davao City. Ten out of 21 respondents residing outside Davao City were from the Province of Davao del Norte.
Client’s Satisfaction Level with CRS Serbilis Outlet’s Performance
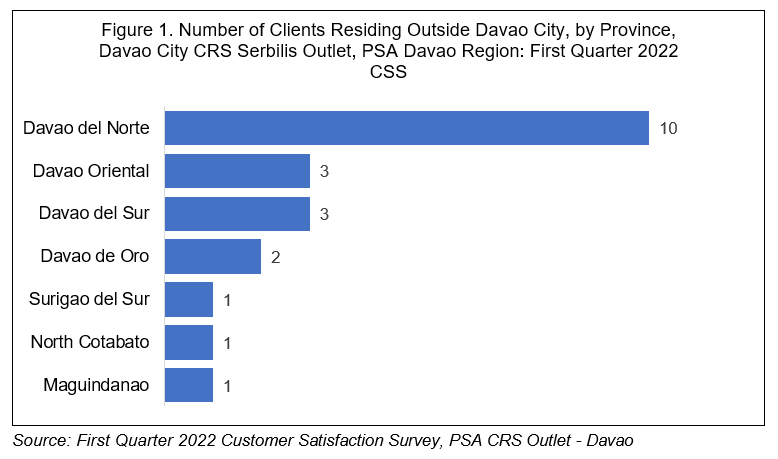
The respondents were asked to rate their level of satisfaction with the performance of Davao City CRS Serbilis Outlet on a scale from 1 (strongly disagree) to 5 (strongly agree). Figure 2 shows that the majority of the respondents are generally satisfied with the performance and delivery of services. Among the categories, enough chairs got the most number for strongly agree with 92 responses, followed by clean surroundings with 81 responses, and comfortable with 78 responses. The category on clean comfort room got the least number of strongly agree with 15 responses.
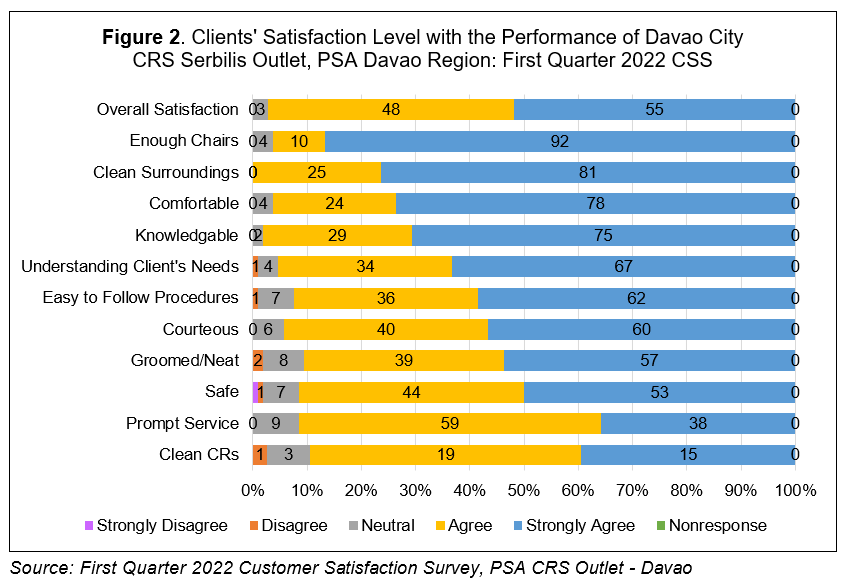
Figure 3 shows the comparative quarterly overall satisfaction rate and net satisfaction rate of Davao City CRS Serbilis Outlet from March 2021 to March 2022. The Overall Satisfaction Rating (OSR) is measured as the percentage of clients surveyed during the reference period who were either satisfied or very satisfied with PSA’s civil registry services. On the other hand, Net Satisfaction Rating (NSR) measures the difference between the proportion of satisfied and dissatisfied clients.
Both the OSR and NSR for the first quarter of 2022 greatly improved and posted at 97.2 percent. The OST increased by 13.4 percentage points compared to fourth quarter of 2021 at 83.7 percent. On the other hand, NSR boosted by 15.0 percent from 82.1 percent during the fourth quarter of 2022.
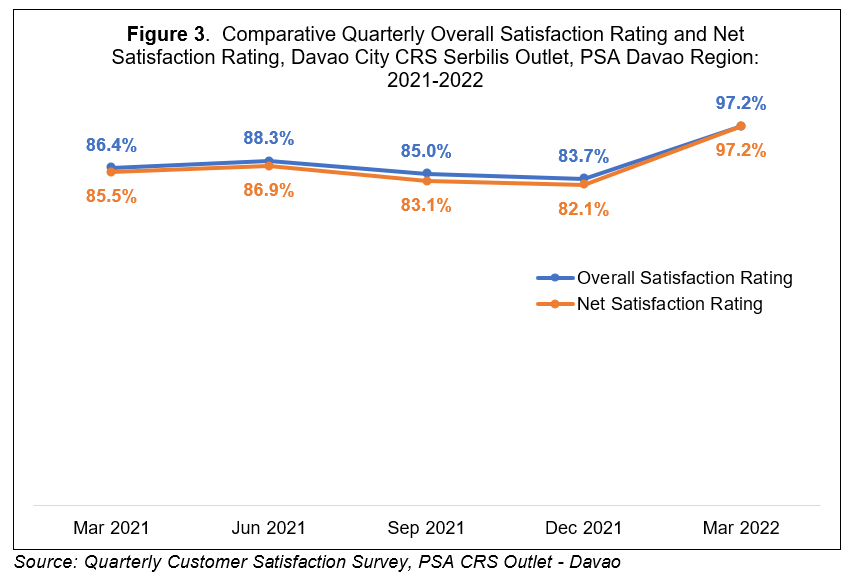
Figure 4 shows the Satisfaction Rating (SR) and Net Satisfaction Rating (NSR) by Client’s Characteristics in March 2022. The SR and NSR for the first quarter of 2022 attained more than 95.0 percent across the clients’ characteristics.

The SR and NR for all demographic characteristics improved in the first quarter of 2022 from fourth quarter of 2021. The SR of clients with Elementary education had the highest increase at 100 percent from 66.7 percent during the 4th quarter of 2021.
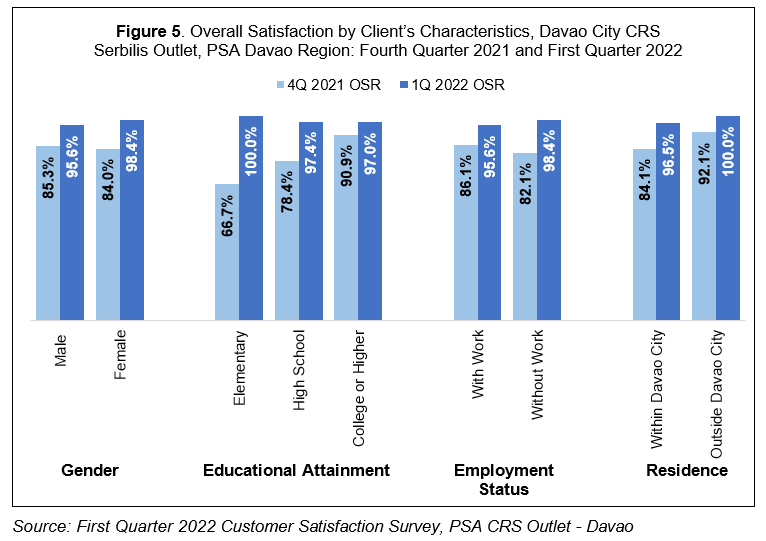
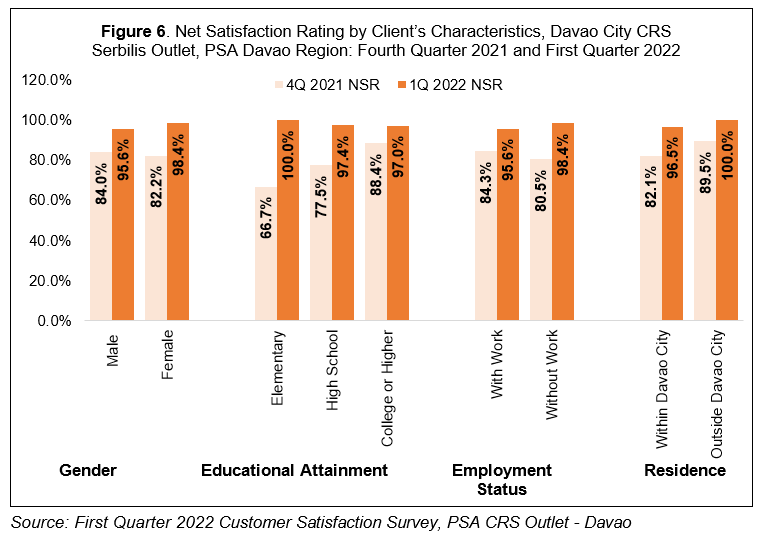
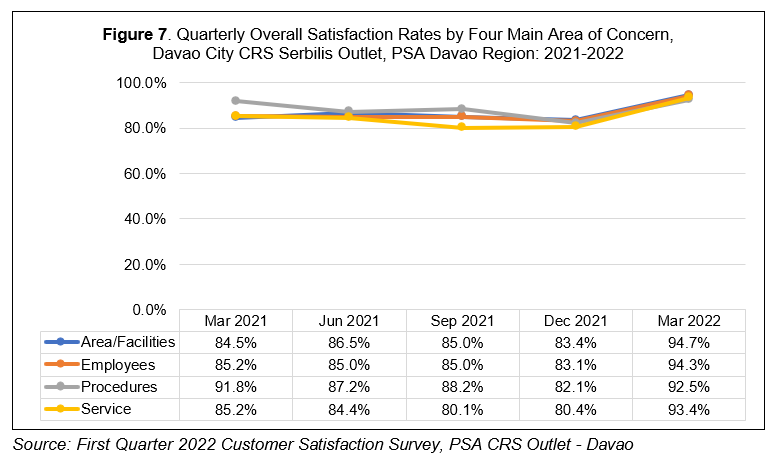
Figure 7 shows the quarterly satisfaction rates by four main area of concerns, namely Service, Employees, Procedures, and Area/Facilities. The SR for the four main area of concerns has increased from 4th Quarter of 2021 to 1st Quarter of 2022. Area/Facilities has the highest SR with 94.7 percent. On the other hand, delivery of service received the lowest OSR with 93.4 percent.
Clients were asked to rate their satisfaction on the promptness of the service, and understanding the client's need. Figure 8 shows the quarterly satisfaction rating on service by sub-item. Understanding Client’s Needs has a higher SR than Promptness of service.
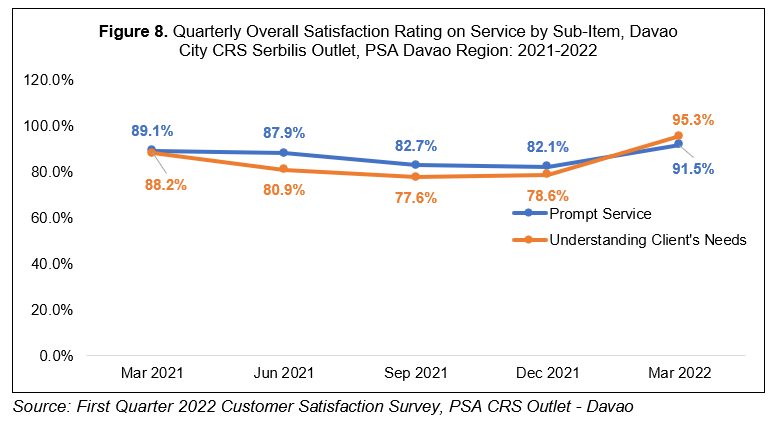
Figure 9 illustrates the quarterly satisfaction rating on employees by sub-item. A marked increase in rating is observed among all sub-items. The SR for employee’s display of knowledge of personnel had the highest SR with 98.1 percent. On the other hand, Grooming and Neatness had the lowest SR with 90.6 percent.
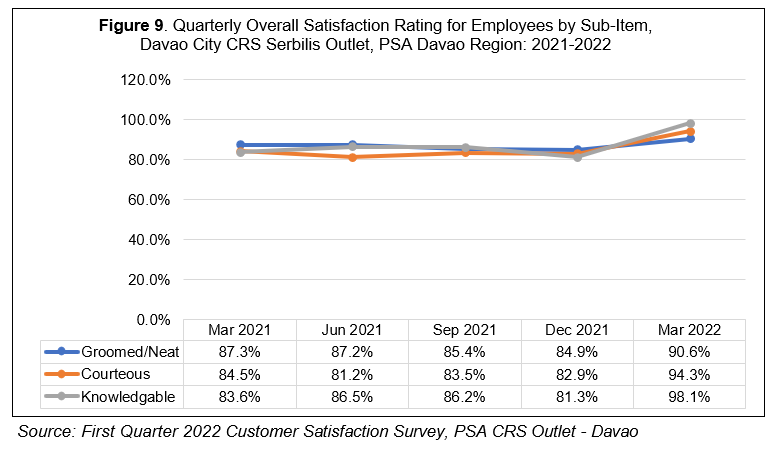
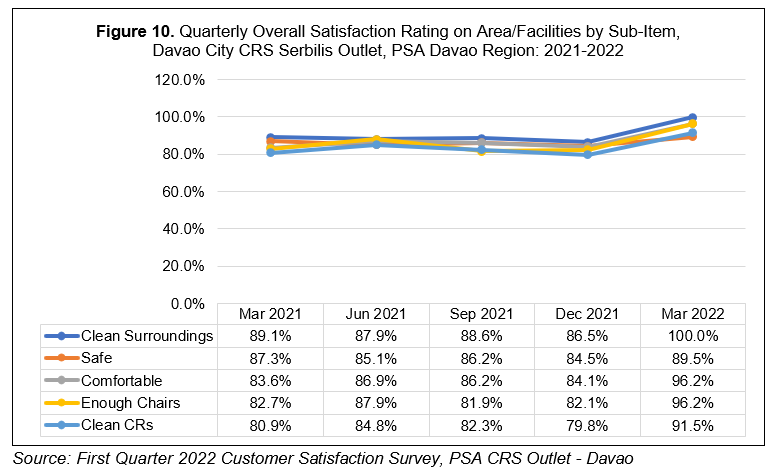
Figure 10 displays the quarterly satisfaction rating on area/facilities by sub-item. There were marked percentage points increase in the clients’ OSR. Clean surroundings received the highest OSR at 100 percent while safety of the area/facilities was the lowest at 89.5 percent.
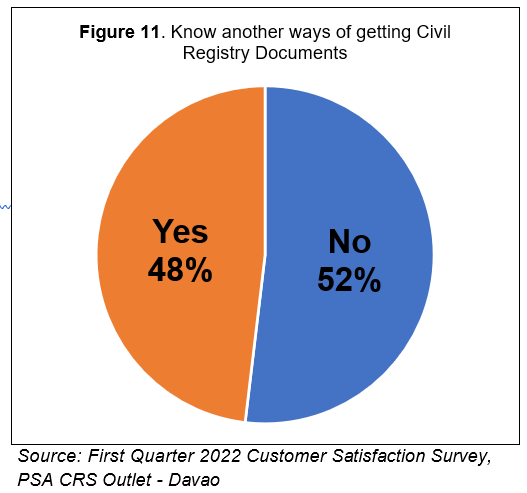
The survey also asked if clients knew of other venues where one can secure a copy of their CRDs. About 48 percent of the clients knew that there are other ways where they can request a copy of their CRDs. Out of the 48 percent, only 24 percent have requested their documents through other venues. Figure 10 displays the proportion of Clients' Awareness of Other Venues where one can Request CRDs.
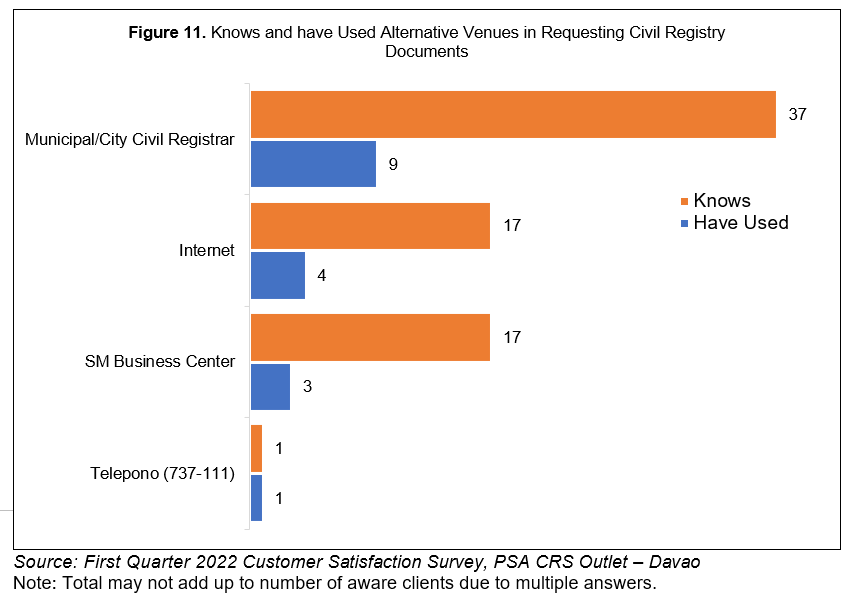
Only 24.0 percent out of the 51 clients who were aware have requested civil registry documents through alternative venues. As alternative, clients were most familiar with requesting CRDs through the Municipal/City Civil Registrar followed by the Internet and SM Business Center. Figure 11 shows the other available venues that the clients were aware of in requesting CRDS.
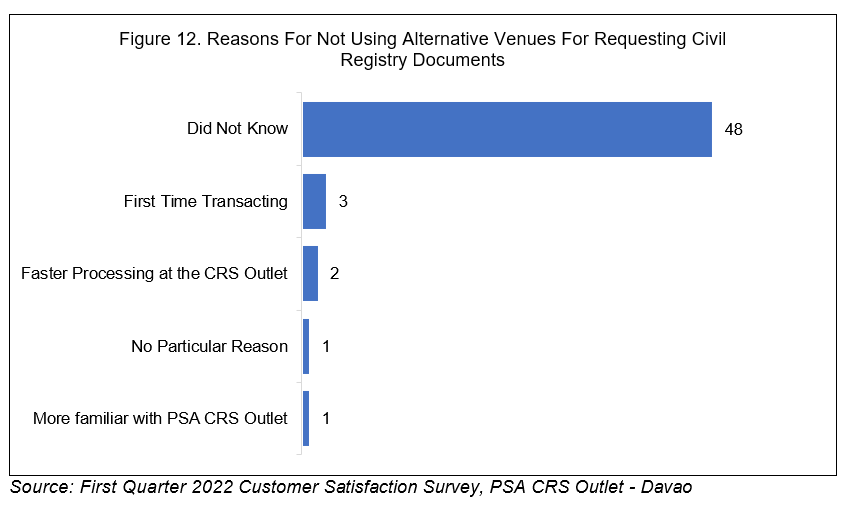
When asked why they did not use alternative venues, did not know/did not know how and first time transacting at PSA CRS Outlet are mentioned as two of the main reasons for not using the alternative venues for requesting civil registry documents. Figure 12 shows the distribution of reasons given for not using alternative venues for requesting CRDs.
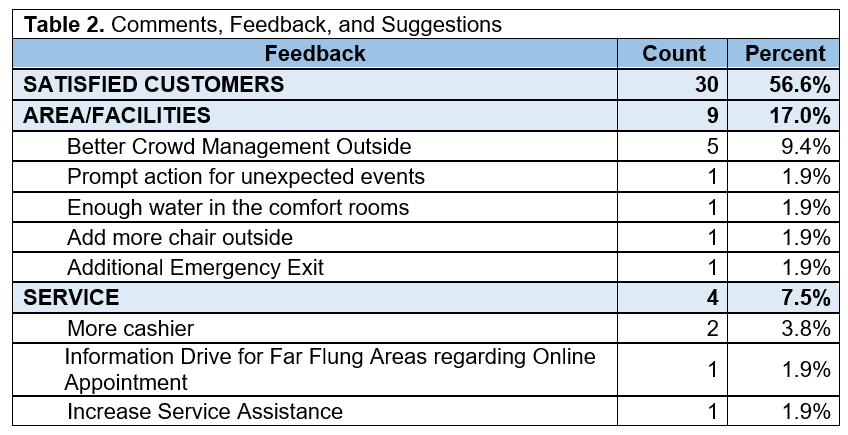
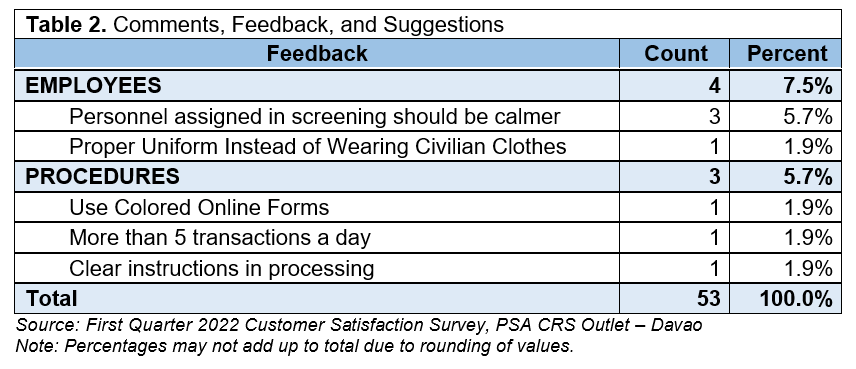
Clients were asked to give comments or suggestions for PSA to continually improve its services. The feedback from 53 respondents were grouped according to the four main concerns. Table 2 shows the consolidated feedback and count of occurrence. Majority of the feedback are commendations from satisfied customers with 57% followed by suggestions to improve on area/facilities with 17.0 percent followed by delivery of service and employees both with 7.5 percent. Procedures got the least feedback with 5.7 percent.
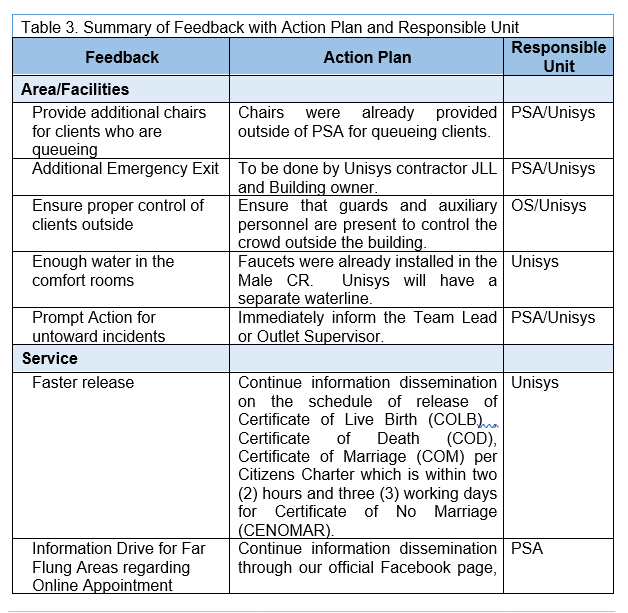
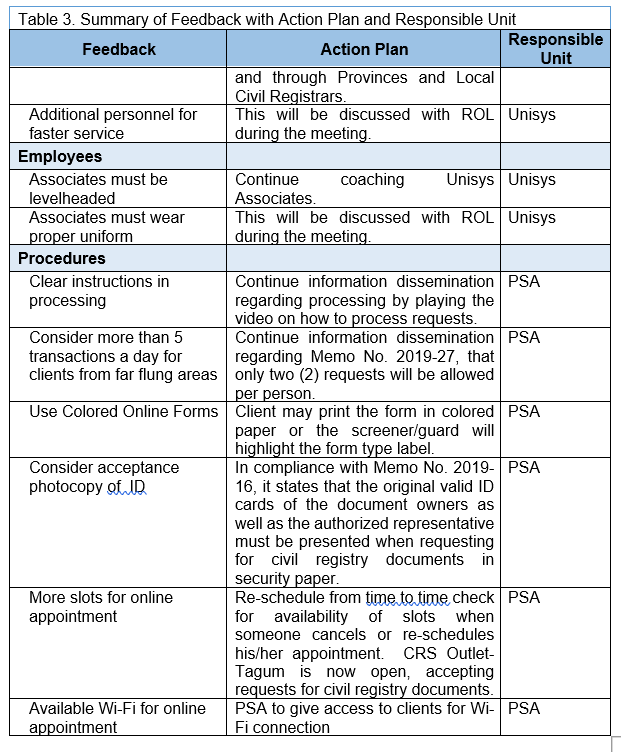
Customer feedback is integral for the development of actionable improvements. An action plan was devised by the office based on the customer feedback. Below is the feedback and action plan for the First Quarter 2022.
APPROVED FOR RELEASE:
RUBEN D. ABARO, JR., CESE
Regional Director
References
Hill, N., Roche, G., & Allen, R. (2007). Customer Satisfaction: The Customer Experience Through the Customer's Eyes. p.7. Retrieved March 26, 2021, from https://books.google.com.ph/books?id=uKQPo_FibAQC&printsec=frontcover&s…
Milner, R., & Furnham, A. (2017, February). Measuring Customer Feedback, Response and Satisfaction. Psychology, Vol.8(No.3), p.350-362. doi:https://doi.org/10.4236/psych.2017.83021
| Attachment | Size |
|---|---|
|
|
5.35 MB |