
Release Date :
Reference Number :
SR-25RSSO11-040
1. Regional Headline Inflation
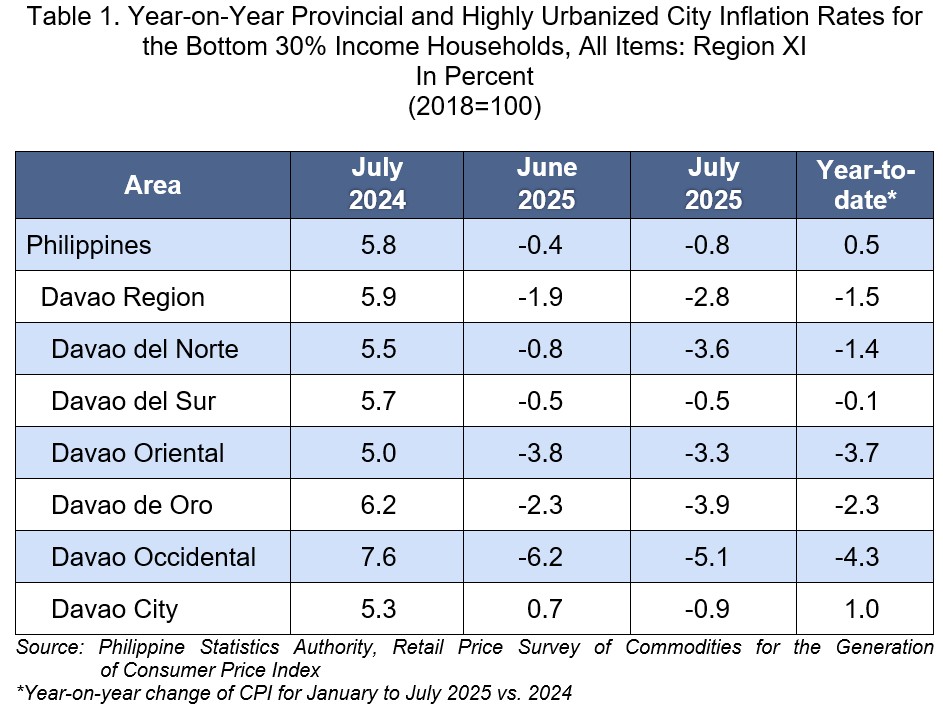
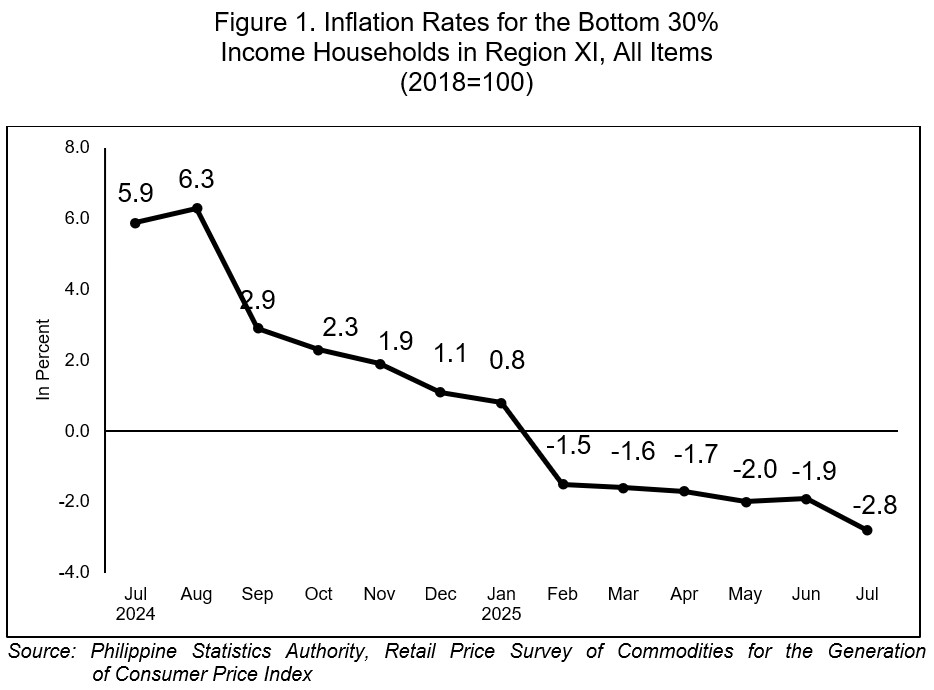
The Davao Region’s inflation rate for Bottom 30% Income Households recorded a faster price decline at -2.8 percent in July 2025, compared to -1.9 percent in June 2025. In July 2024, the region’s inflation was higher at 5.9 percent. (Table 1 and Figure 1).
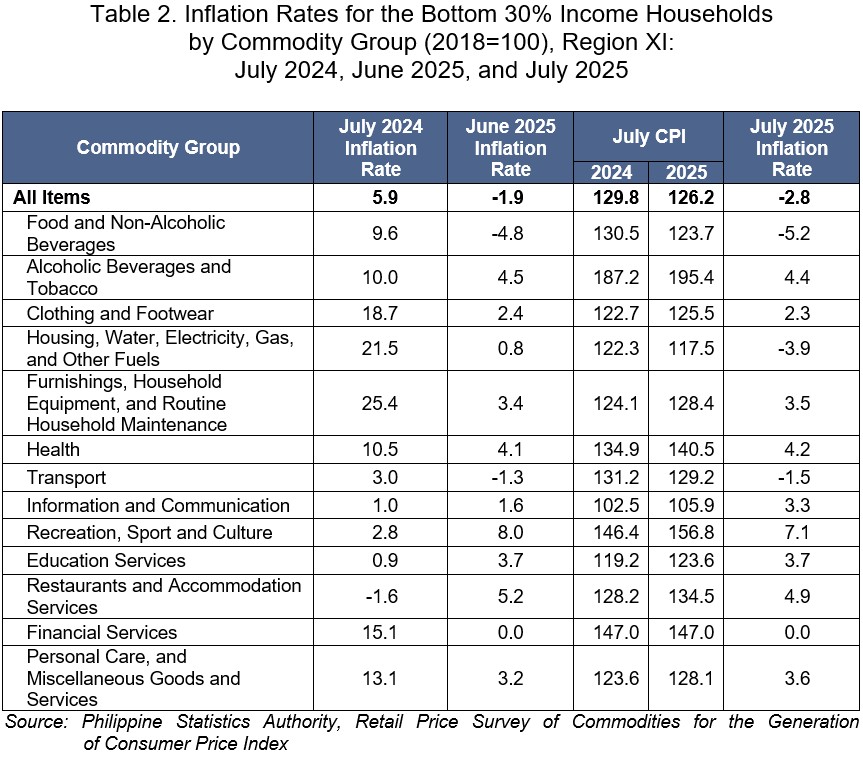
The downtrend in the region’s overall inflation for the Bottom 30% Income Households in July 2025 was primarily due to the slower annual growth in the indices of Housing, Water, Electricity, Gas, and other Fuels, at -3.9 percent from 0.8 percent, Food and Non-Alcoholic Beverages, at -5.2 percent from -4.8 percent, and Restaurants and Accommodation Services, at 4.9 percent from 5.2 percent.
Moreover, the following commodity groups recorded slower price movements in July 2025 than in June 2025:
a. Alcoholic Beverages and Tobacco, at 4.4 percent from 4.5 percent.
b. Clothing and Footwear at 2.3 percent from 2.4 percent;
c. Transport, at -1.5 percent from -1.3 percent; and
d. Recreation, Sport, and Culture, at 7.1 percent from 8.0 percent.
On the other hand, faster annual increments were recorded in the following commodity groups:
a. Furnishings, Household Equipment, and Routine Household Maintenance at 3.5 percent from 3.4 percent;
b. Health at 4.2 percent from 4.1 percent;
c. Information and Communication at 3.3 percent from 1.6 percent; and
d. Personal Care, and Miscellaneous Goods and Services at 3.6 percent from 3.2 percent.
Meanwhile, Education Services, at 3.7 percent, and Financial Services, at 0.0 percent, retained their previous month’s inflation rate.
2. Davao Region Food Inflation
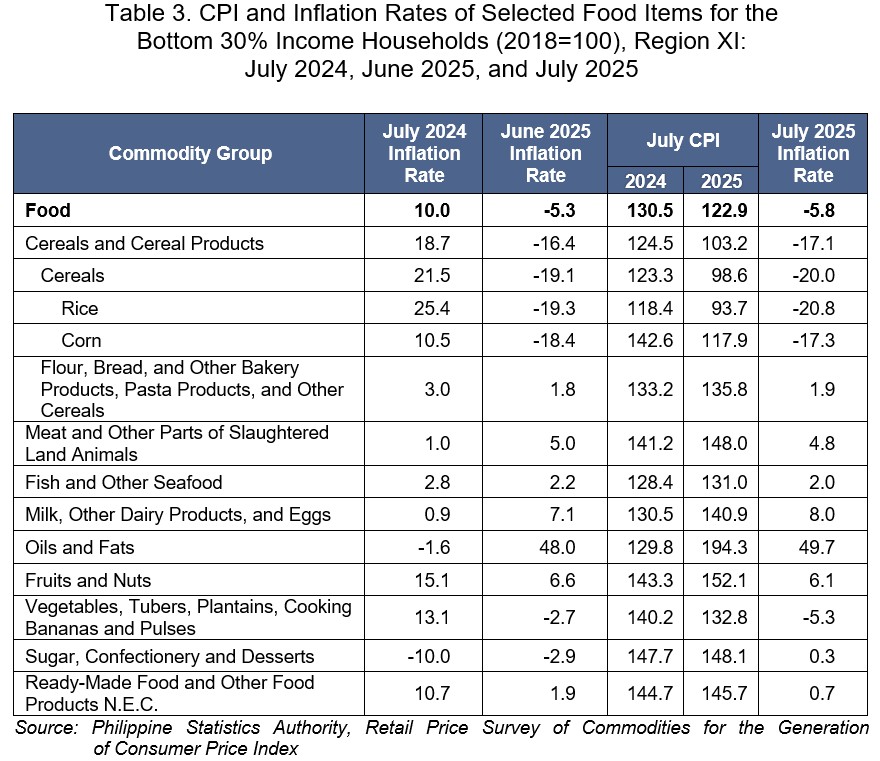
The food inflation for Bottom 30% Income Households at the regional level posted a faster price decline at -5.8 percent in July 2025, from -5.3 percent in the previous month. In July 2024, the Food inflation was higher at 10.0 percent. (Table 3)
The main contributors to the downtrend of overall food inflation in the region in July 2025 were Cereals and Cereal Products, at -17.1 percent from -16.4 percent, and Vegetables, Tubers, Plantains, Cooking Bananas and Pulses, at -5.3 percent from -2.7 percent.
Additionally, the following food groups recorded slower year-on-year price movements in July 2025 than in June 2025, namely:
a. Meat and Other Parts of Slaughtered Land Animals, at 4.8 percent from 5.0 percent;
b. Fish and Other Seafood at 2.0 percent from 2.2 percent;
c. Fruits and Nuts at 6.1 percent from 6.6 percent; and
d. Ready-Made Food and Other Food Products N.E.C., at 0.7 percent from 1.9 percent.
On the other hand, the following food groups recorded faster year-on-year price movements, namely:
a. Milk, Other Dairy Products and Eggs at 8.0 percent from 7.1 percent;
b. Oils and Fats at 49.7 percent from 48.0 percent; and
c. Sugar, Confectionery, and Desserts, at 0.3 percent from -2.9 percent.
3. Regional Inflation Rates
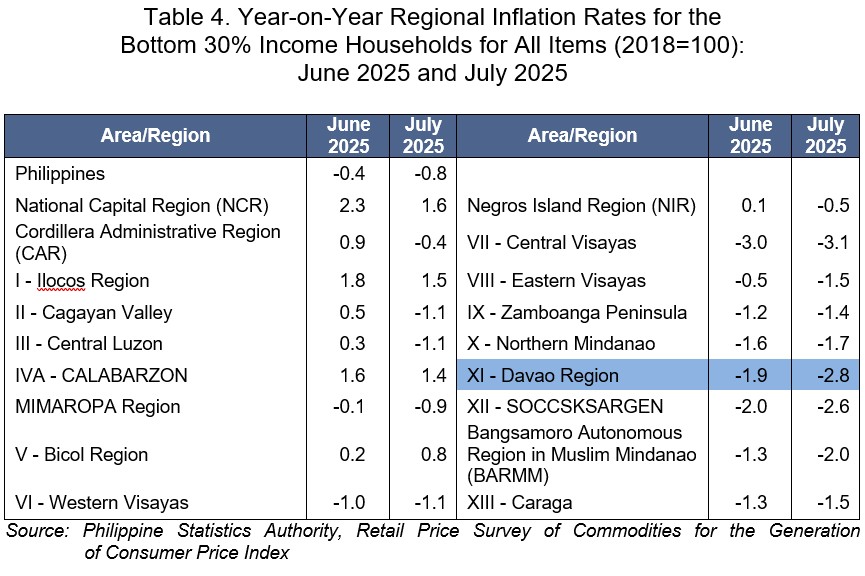
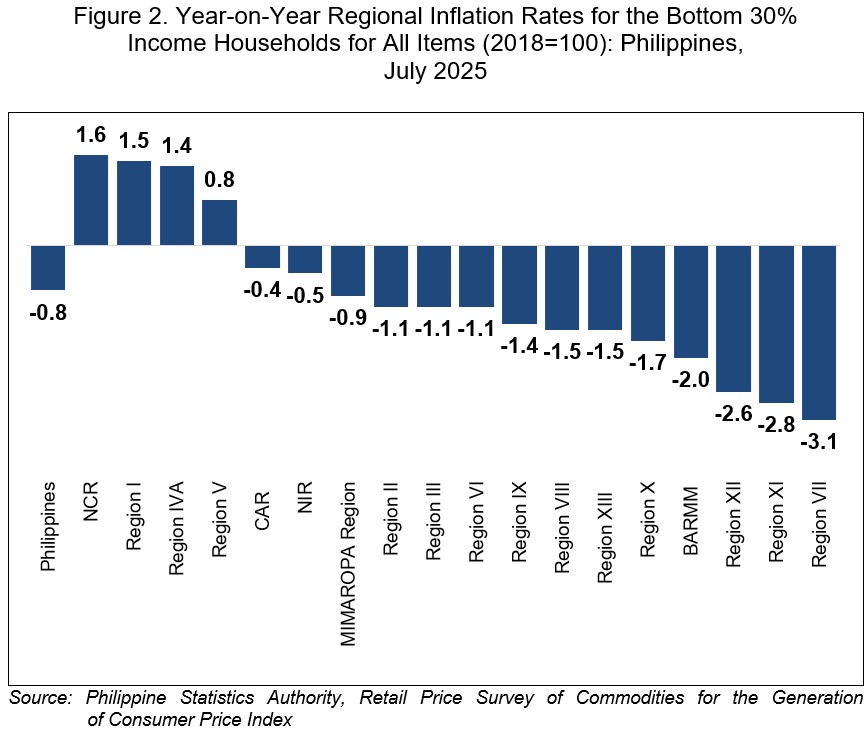
At the national level, the country's inflation for the Bottom 30% Income Households decline at -0.8 percent in July 2025 from -0.4 percent in June 2025. (Table 4 and Figure 2)
Among the 18 administrative regions, the National Capital Region (NCR) had the highest inflation at 1.6 percent, followed by Region I (Ilocos Region), at 1.5 percent, and Region IVA (CALABARZON), at 1.4 percent. On the other hand, Region VII (Central Visayas) had the lowest inflation at -3.1 percent.
________________________________________________________________________________________________
Note: CPIs and inflation rates by province and selected cities are posted on the PSA website (https://openstat.psa.gov.ph/).
APPROVED FOR RELEASE:
BABY JEAN P. ALID
(Chief Administrative Officer)
Officer-In-Charge
Regional Statistical Services Office XI
| Attachment | Size |
|---|---|
|
|
730.19 KB |