
Release Date :
Reference Number :
SR-25RSSO11-033
1. Regional Headline Inflation
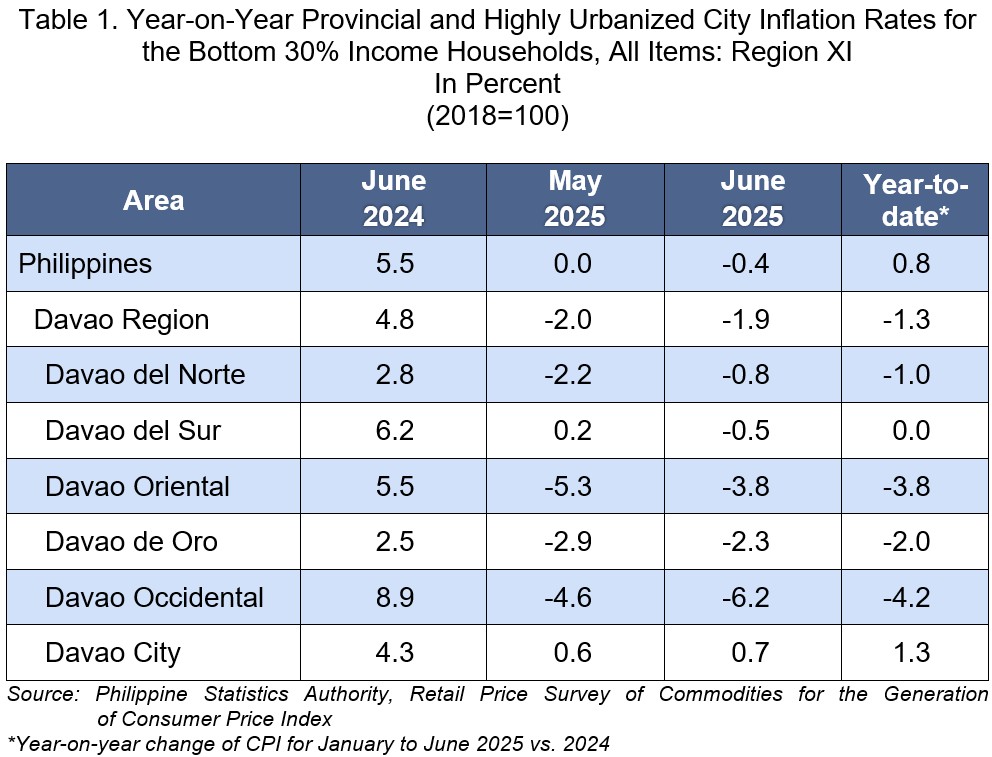
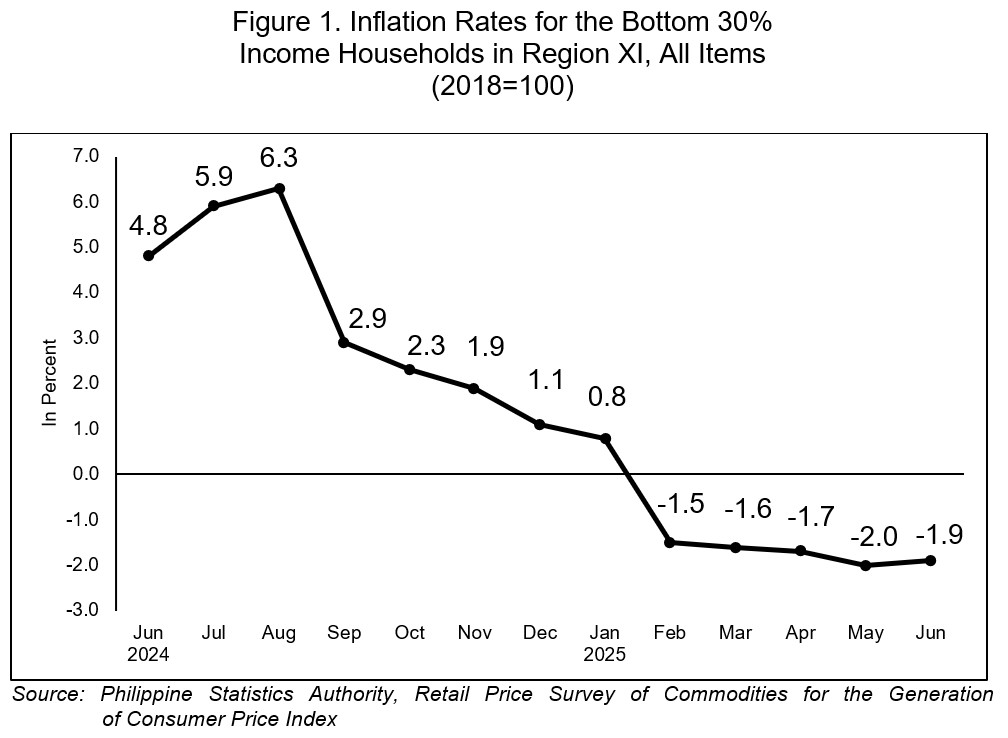
The Davao Region’s inflation rate for Bottom 30% Income Households recorded a slower price decline of -1.9 percent in June 2025, compared to -2.0 percent in May 2025. In June 2024, the region’s inflation was higher at 4.8 percent. (Table 1 and Figure 1).
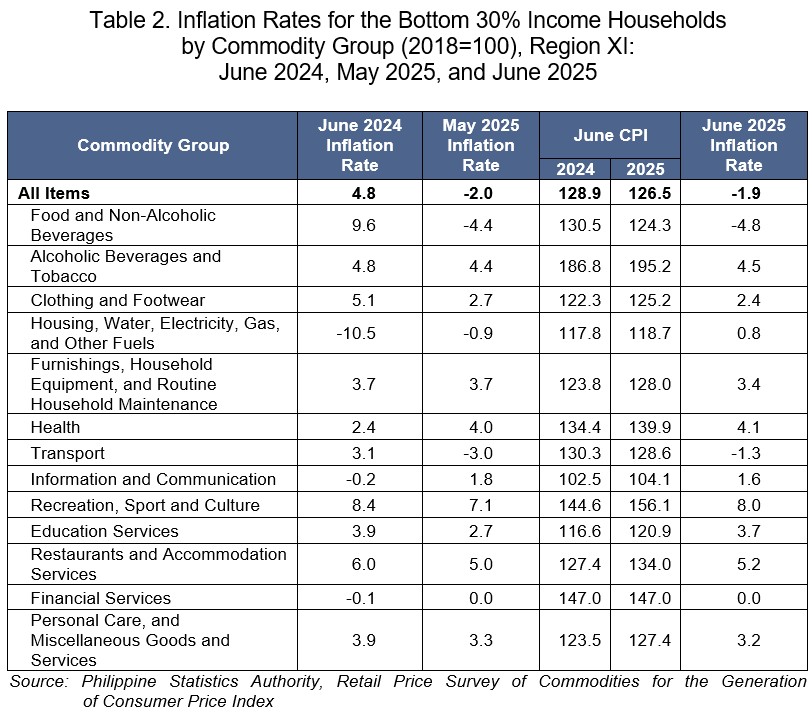
The uptrend in the region’s overall inflation for the Bottom 30% Income Households in June 2025 was primarily due to the faster annual growth in the indices of Housing, Water, Electricity, Gas, and other Fuels, at 0.8 percent from -0.9 percent; Transport, at -1.3 percent from -3.0 percent; and Restaurants and Accommodation Services, at 5.2 percent from 5.0 percent.
Moreover, the following commodity groups recorded faster price movements in June 2025 than in May 2025:
a. Alcoholic Beverages and Tobacco, at 4.5 percent from 4.4 percent;
b. Health at 4.1 percent from 4.0 percent;
c. Recreation, Sport, and Culture, at 8.0 percent from 7.1 percent; and
d. Education Services, at 3.7 percent from 2.7 percent.
On the other hand, lower annual increments were recorded in the following commodity groups:
a. Food and Non-Alcoholic Beverages, at -4.8 percent from -4.4 percent;
b. Clothing and Footwear at 2.4 percent from 2.7 percent;
c. Furnishings, Household Equipment, and Routine Household Maintenance at 3.4 percent from 3.7 percent;
d. Information and Communication at 1.6 percent from 1.8 percent; and
e. Personal Care, and Miscellaneous Goods and Services at 3.2 percent from 3.3 percent.
Meanwhile, Financial Services, at 0.0 percent, retained their previous month’s inflation rate.
2. Davao Region Food Inflation
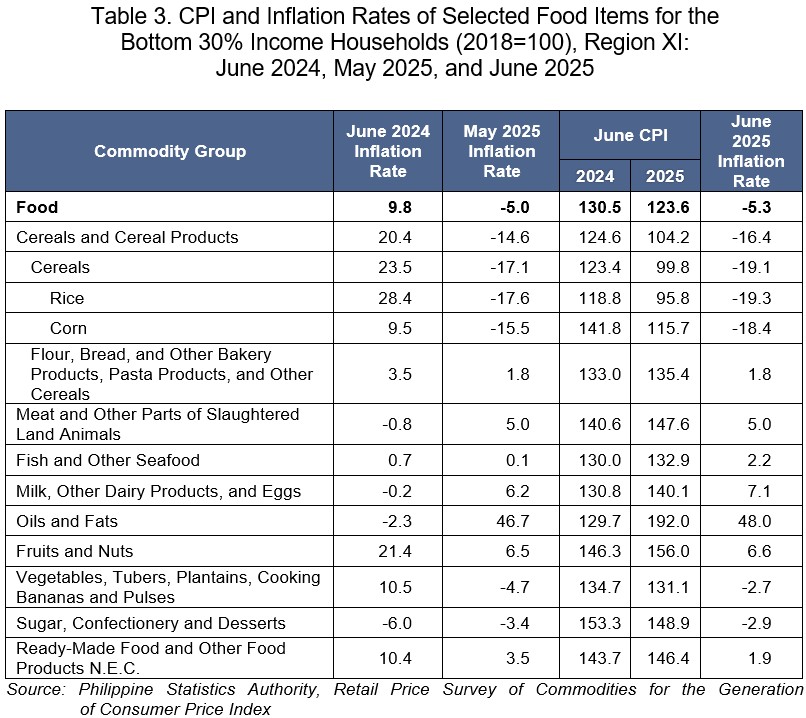
The food inflation for Bottom 30% Income Households at the regional level posted a faster price decline of -5.3 percent in June 2025, from -5.0 percent in the previous month. In June 2024, the Food inflation was higher at 9.8 percent. (Table 3)
The main contributors to the downtrend of overall food inflation in the region in June 2025 were Cereals and Cereal Products, at -16.4 percent from -14.6 percent, and Ready-Made Food and Other Food Products N.E.C., at 1.9 percent from 3.5 percent.
On the other hand, the following food groups recorded faster year-on-year price movements, namely:
a. Fish and Other Seafood at 2.2 percent from 0.1 percent;
b. Milk, Other Dairy Products and Eggs at 7.1 percent from 6.2 percent;
c. Oils and Fats at 48.0 percent from 46.7 percent;
d. Fruits and Nuts at 6.6 percent from 6.5 percent;
e. Vegetables, Tubers, Plantains, Cooking Bananas and Pulses, at -2.7 percent from -4.7 percent; and
f. Sugar, Confectionery, and Desserts, at -2.9 percent from -3.4 percent.
Meanwhile, the food group of Meat and Other Parts of Slaughtered Land Animals, at 5.0 percent, retained its previous month’s inflation.
3. Regional Inflation Rates
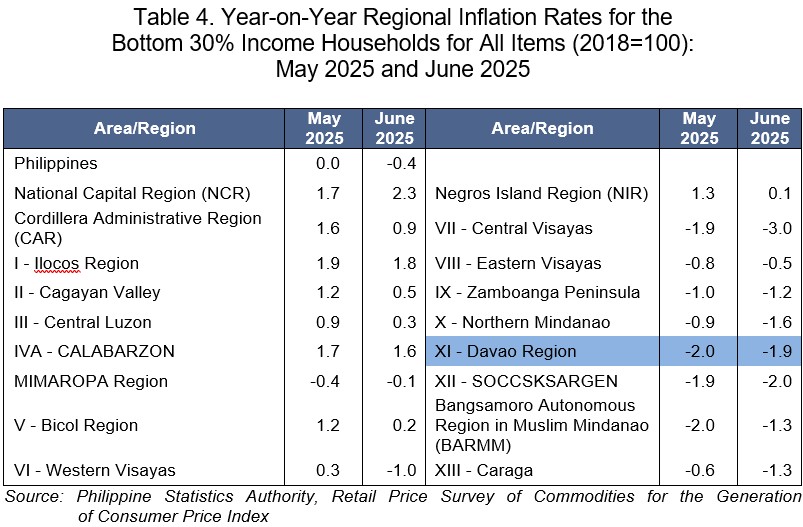
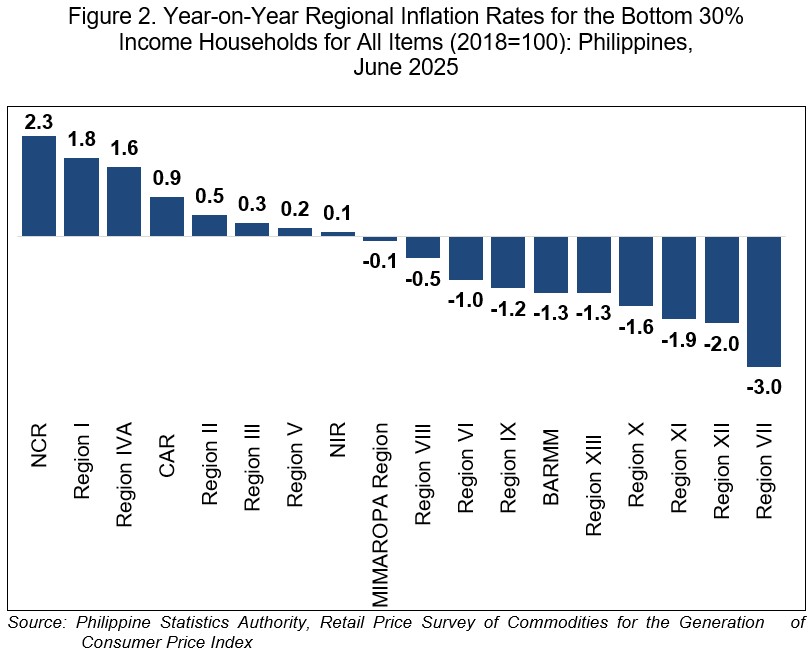
At the national level, the country's inflation for the Bottom 30% Income Households decreased to -0.4 percent in June 2025 from 0.0 percent in May 2025. (Table 4)
Among the 18 administrative regions, the National Capital Region (NCR) had the highest inflation at 2.3 percent, followed by Region I (Ilocos Region) at 1.8 percent, and Region IVA (CALABARZON) at 1.6 percent. On the other hand, Region VII (Central Visayas) had the lowest inflation at -3.0 percent. (Table 4 and Figure 2)
__________________________________________________________________________________________________________
Note: CPIs and inflation rates by province and selected cities are posted on the PSA website
(https://openstat.psa.gov.ph/).
APPROVED FOR RELEASE:
RANDOLPH ANTHONY B. GALES
(Chief Statistical Specialist)
Officer-In-Charge
Regional Statistical Services Office 11
TECHNICAL NOTES
Consumer Price Index (CPI) The CPI is an indicator of the change in the average prices of goods and services commonly purchased by consumers.
Uses of CPI The CPI is most widely used in the calculation of the inflation rate and purchasing power of peso. It is a major statistical series used for economic analysis and as a monitoring indicator of government economic policy.
Computation of CPI The computation of the CPI involves consideration of the following important points:
a. Base Period Base year is a reference period, usually a year, at which the index number is set to 100. It is the reference point of the index number series. The CPI is rebased from the base year 2012 to the base year 2018.
b. Market Basket Market basket refers to a sample of goods and services commonly purchased by households.
c. Weighting System The weighting pattern uses the expenditures on various consumer items purchased by households as a proportion of total expenditure.
|
|
d. Formula The 2018-based CPI series uses the same method of computation as the 2012-based CPI series, which is Chained Laspeyres formula.
e. Geographic Coverage CPI values are computed at the national, regional, and provincial levels, and Highly Urbanized Cities.
Inflation Rate is the rate of change of the CPI expressed in percent. Inflation is interpreted in terms of the declining purchasing power of peso.
Headline Inflation refers to the rate of change in the CPI, a measure of the average standard “basket” of goods and services consumed by a typical family.
Purchasing Power of Peso shows how much the peso in the base period is worth in the current period. It is computed as the reciprocal of the CPI for the period under review multiplied by 100.
How does the PSA compile the CPI for the bottom 30% income households? The CPI for the bottom 30% income households is compiled by the PSA to measure the changes of prices of commodities commonly purchased by the families that belong to the bottom 30% income decile. The process of price collection and CPI computation is the same as that of the CPI for all income households. However, there is a separate market basket and weights for the CPI for the bottom 30% income households. |