
Release Date :
Reference Number :
SR-RSSO11-038
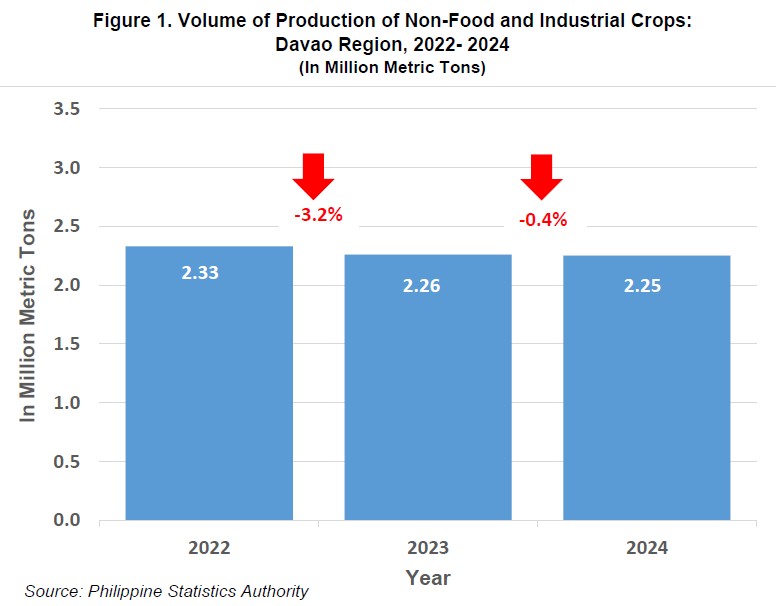
Non-Food and Industrial Crops production slightly reduced by 0.4 percent
Non-Food and Industrial Crops (NFICs) production in the region registered 2,258.37 Metric Tons (MT) in 2024. It declined slightly by 0.4 percent from 2,266,137.09 MT in 2023. The decrease was mainly attributed to the production drop of coconut. Similarly, from 2022 to 2023 NFICs production decreased by 3.2 percent.
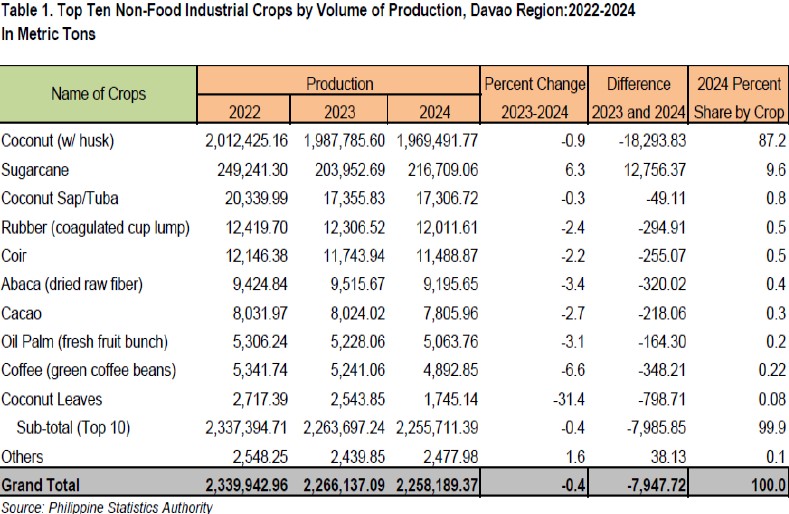
Top 10 Non-Food and Industrial Crops by Volume of Production
The top 10 Non-Food and Industrial Crops in 2024 accounted for 99.9 percent of the total production in the region while the rest merely contributed 0.1 percent.
• Coconut accounted for 87.2 percent of the total production at 1,969,491.77 MT. Its production contracted by 0.9 percent in 2024. It likewise decreased by 1.2 percent in 2023.
• Sugarcane ranked second, contributed 9.6 percent to total production at 216,709.06 MT. Its production increased by 6.3 percent in 2024, a significant turnaround from a decrease of 18.2 percent in 2023.
• At third, coconut sap or commonly known as tuba yielded 17,306.72 MT. It declined by 0.3 percent in 2024, a slowdown from a dropped of 14.7 percent in 2023.
• Rubber (coagulated cup lump) extracted 12,011.61 MT, decreasing 2.4 percent and 0.9 percent in 2024 and 2023, respectively.
• Coco coir yielded 11,488.87 MT. Its production both dropped in 2024 and 2023 by 2.2 percent and 3.3 percent, correspondingly.
• Abaca (dried raw fiber) generated 9,195.65 MT, it shrunk by 3.4 percent in 2024, a reversal from an increase of 1.0 percent in 2023.
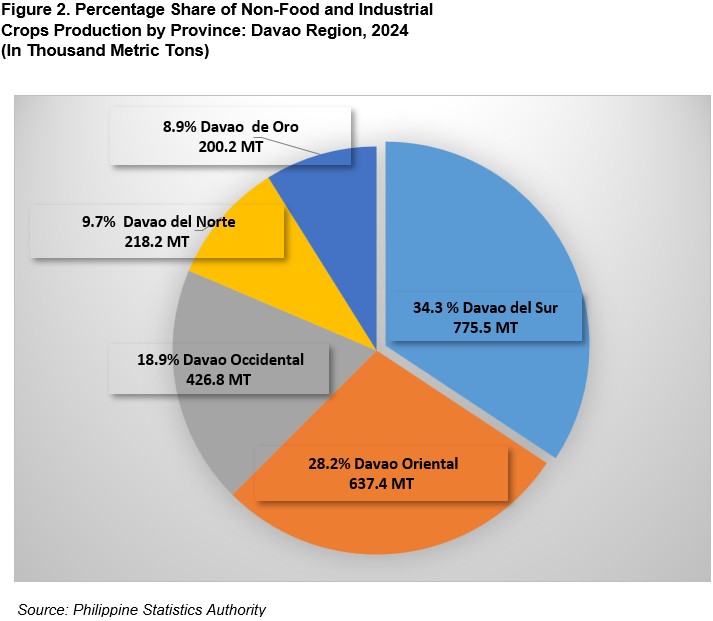
Non-Food and Industrial Crops Production by Province
Davao del Sur recorded the biggest percentage share of Non-Food and Industrial Crops production in 2024 with 34.3 percent to total production or 775,509.49 MT.
Davao Oriental contributed 28.2 percent to total production in 2024 estimated at 637,415.53 MT.
Followed by Davao Occidental with 18.9 percent share or a yield of 426,812.65 MT.
Davao del Norte and Davao de Oro shared the least in the total production, contributing 9.7 percent and 8.9 percent or 218,220.55 MT and 200,231.16 MT, respectively.
TECHNICAL NOTES
The data from this Special Release was based on the Crops Production Survey (CrPS). It is a quarterly survey which aims to generate basic production statistics for crops other than palay and corn at the national and sub-national levels. It covers more than 280 crops sub-classified under three commodity groupings, namely: 1) Non-Food and Industrial Crops, 2) Fruit Crops, and 3) Vegetables and Rootcrops. The commodity coverage by province differs and depends on what each province produces.
Crop Production is the quantity produced and actually harvested for a particular crop during the reference period. It includes those measured but damaged, stolen, given away, consumed, given as harvesters’ and threshers’ shares, reserved etc. Excluded are those produced but not harvested for whatever reasons such as due to low price, lack of demand and force majeure or fortuitous events, etc.
CrPS survey results are posted at the PSA website (https://openstat.psa.gov.ph).
APPROVED FOR RELEASE:
BABY JEAN P. ALID
(Chief Administrative Officer)
Officer-in-Charge
Regional Statistical Services Office 11
| Attachment | Size |
|---|---|
|
|
1.47 MB |