
Release Date :
Reference Number :
SR-2025-06PSO24-025
CITY OF DAVAO
1. Headline Inflation
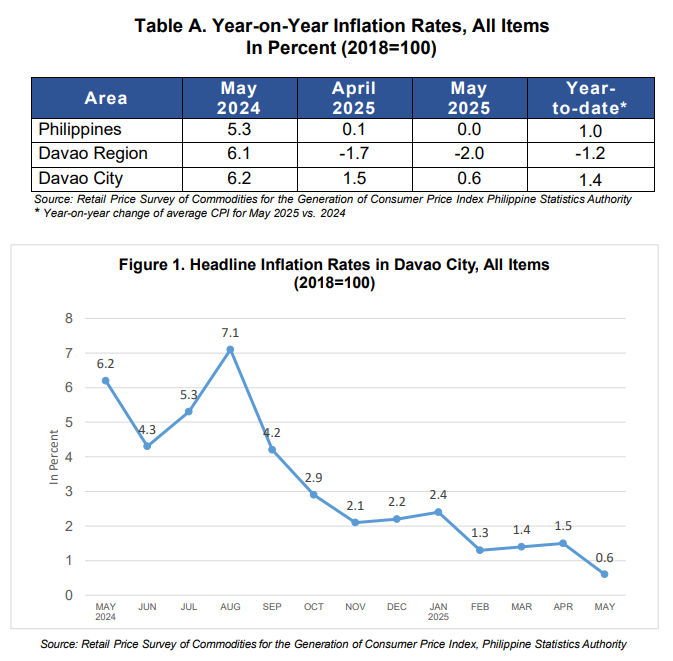
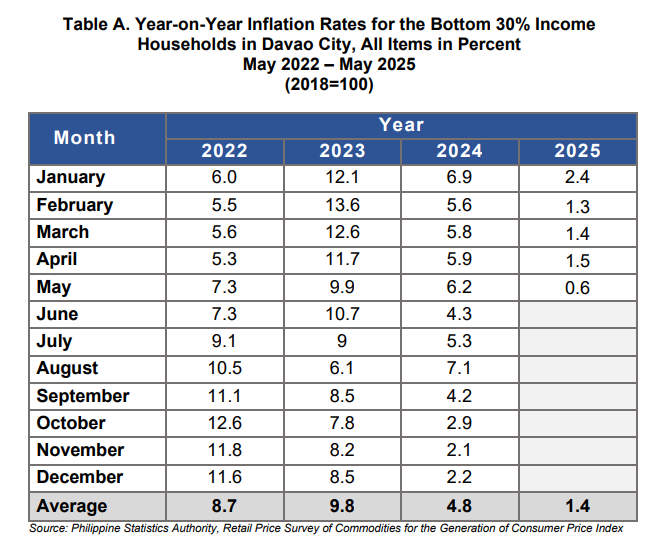
In May 2025, the headline or overall inflation in the City of Davao for the Bottom 30% Income Households decreased at 0.6 percent, reflecting a 0.9 percentage points lower from the April 2025 rate of 1.5 percent. Notably, the current inflation rate was 5.6 percentage points lower than the figure reported in May 2024 at 6.2 percent. (Table A and Figure 1).
1.1 Main Drivers Contributing to the Lower Inflation of the Bottom 30% Income Households
The major contributor to the lower inflation of the Bottom 30% Income Households in the city was a) Housing, Water, Electricity, Gas and Other Fuels at negative 2.6 percent from 1.8 percent in the previous month. Also contributing to the city’s headline inflation for the Bottom 30% Income Households was b) Food and Non-Alcoholic beverages at 0.8 percent, from 1.0 percent in the previous month. The third major contributor was c) Health at 5.7 percent, from 6.4 percent in the previous month.
Moreover, slower annual growth in the indices was also observed in Clothing and Footwear at 2.9 percent, from 3.0 percent; and Recreation, Sport, and Culture at 13.2 percent, from 13.3 percent in the previous month.
On the other hand, the following commodity groups recorded faster price movements in May 2025:
a) Furnishings, Household Equipment, and Routine Household Maintenance at 4.7 percent, from 4.6 percent in the previous month;
b) Transport was at negative 2.5 percent, from negative 2.7 percent in the previous month; and
c) Personal Care, and Miscellaneous Goods and Services at 6.2. percent, from 5.9 percent in the previous month.
Meanwhile, the commodity groups of Information and Communication at 0.1 percent; Education Services at 21.3 percent; Restaurants and Accommodation Services at 2.0 percent, Alcoholic Beverages and Tobacco at 4.0 percent, and Financial Services at 0.0 percent retained their previous month’s inflation rates.
2. Food Inflation
The food inflation for the Bottom 30% Income Households in the city decreased to 0.8 percent in May 2025 from 0.9 percent in the previous month. The decrease was mainly due to a) Fish and other seafood at 7.3 percent, from 9.1 percent in the previous month. This was followed by b) Ready-made food and other products at 3.3 percent, from 4.6 percent in the previous month; Also, c) Vegetables, tubers, plantains, cooking bananas and pulses at 1.4 percent, from 4.2 percent in the previous month.
In contrast, increasing rates in food inflation were observed in the following food commodities:
a) Meat and other parts of slaughtered land animals at 6.6 percent, from 5.5 percent in the previous month;
b) Oils and fats at 25.5 percent, from 18.4 percent in the previous month;
c) Milk, other dairy products, and eggs at 5.1 percent, from 4.2 percent in the previous month;
d) Fruits and nuts at 6.3 percent, from 3.4 percent in the previous month;
e) Sugar, Confectionery, and Desserts at 0.8 percent, from negative 1.0 percent in the previous month; and
f) Cereals and cereal products at negative 6.2 percent, from negative 6.3 percent in the previous month.
Technical Notes:
Consumer Price Index (CPI) - The CPI is an indicator of the change in the average retail prices of a fixed basket of goods and services commonly purchased by households relative to a base year.
Inflation Rate (IR) - The inflation rate is the annual rate of change, or the year-on-year change of the CPI expressed in percent. Inflation is interpreted in terms of declining purchasing power of money.
Bottom 30% Household - Families that belong in the low-income bracket and the most vulnerable to economic and social difficulties. Based on the “relative poverty” concept, a household whose per capita income falls below the bottom 30% of the cumulative per capita distribution belongs to the low-income group.
One of the common characteristics of households in this income group is that expenditures on food items account for a more substantial proportion of expenditures compared to expenditures on other items. Price changes in food, therefore, would be expected to greatly affect this income group more than any other group.
Headline Inflation - measures changes in the cost of living based on movements in the prices of a specified basket of major commodities. It refers to the annual rate of change or the year-on-year change in the Consumer Price Index (CPI).
Approved for Release:
ADELINE G. BATUCAN
(Supervising Statistical Specialist)
Officer-In-Charge
Davao del Sur Provincial Statistical Office
| Attachment | Size |
|---|---|
|
|
385.96 KB |