
Release Date :
Reference Number :
SR-1125-2025-004
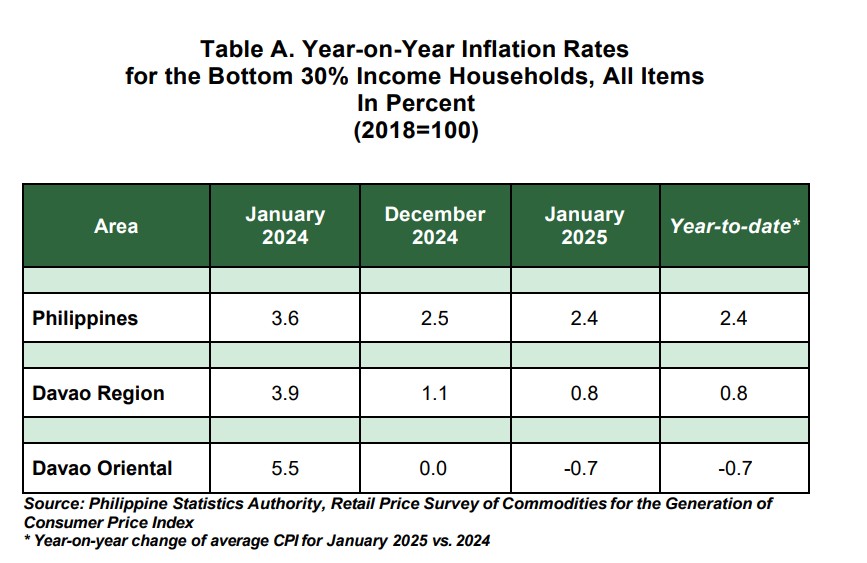
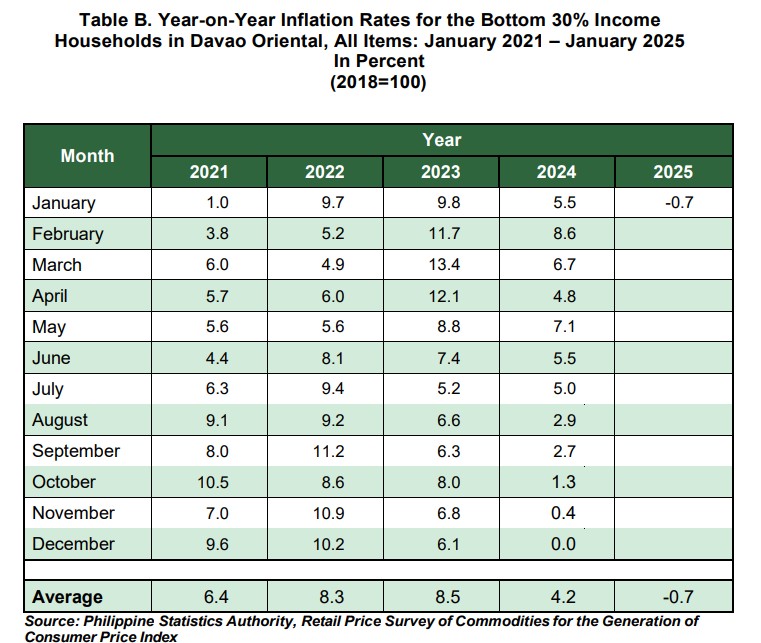
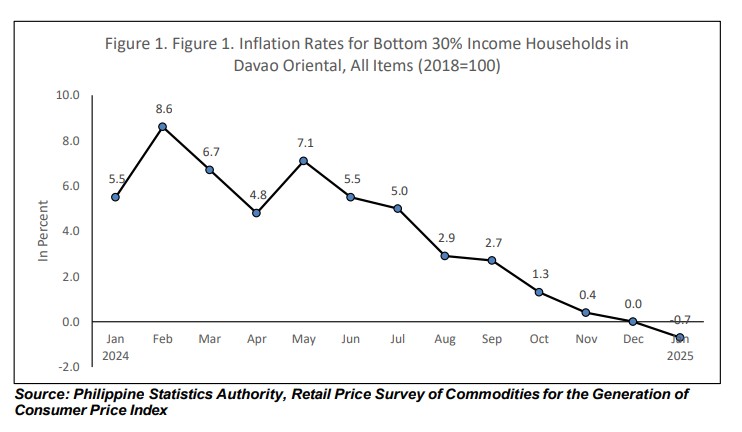
The inflation rate for the bottom 30% income households in the province slowed down to -0.7 percent in January 2025 from 0.0 percent in December 2024. In January 2024, the inflation rate was posted at 5.5 percent. (Tables A and B, and Figure 1)
The downtrend in the overall inflation for the bottom 30% income households in January 2025 was primarily brought about by the lower yearon-year growth rate in food and non-alcoholic beverages index at 0.3 percent in January 2025 from 1.1 percent in the previous month. Additionally, the faster annual decline in the housing, water, electricity, gas and other fuels index at -9.0 percent during the month from -7.2 percent in December 2024, along with the slower growth in the recreation, sport, and culture index at 4.5 percent from 5.6 percent, also contributed to the overall inflation slowdown.
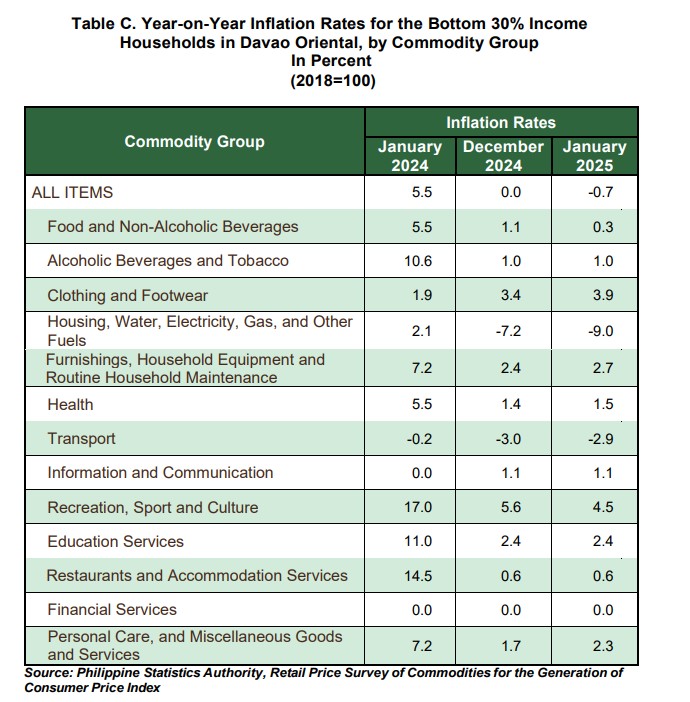
In contrast, higher annual growth rates were noted in the indices of the following commodity groups during the month:
a. Clothing and footwear, 3.9 percent from 3.4 percent;
b. Furnishings, household equipment and routine household maintenance, 2.7 percent from 2.4 percent; c. Health, 1.5 percent from 1.4 percent;
d. Transport, -2.9 percent from -3.0 percent; and
e. Personal care, and miscellaneous goods and services, 2.3 percent from 1.7 percent.
The indices of the rest of the commodity groups retained their respective previous month’s annual rates. (Tables C)
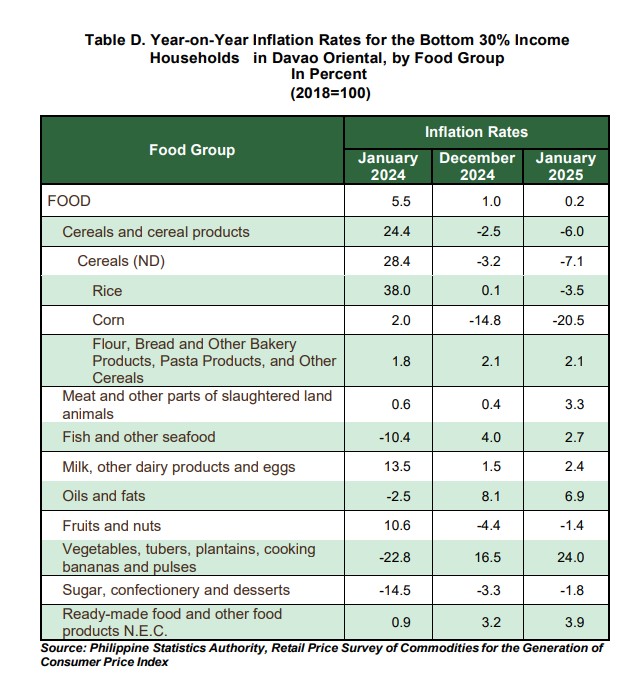
Food inflation for the bottom 30% income households at the provincial level moved at a slower pace of 0.2 percent in January 2025 from 1.0 percent in the previous month. In January 2024, its annual increase was observed at 5.5 percent. (Table D).
The deceleration of food inflation was mainly due to the annual decline in the rice index at -3.5 percent during the month from a 0.1 percent annual increase in December 2024.
Moreover, lower inflation rates during the month were noted in the following food groups:
a. Corn, -20.5 percent from -14.8 percent;
b. Fish and other seafood, 2.7 percent from 4.0 percent; and
c. Oils and fats, 6.9 percent from 8.1 percent.
In contrast, higher annual increases were noted in the following food groups:
a. Meat and other parts of slaughtered land animals, 3.3 percent from 0.4 percent;
b. Milk, other dairy products and eggs, 2.4 percent from 1.5 percent;
c. Fruits and nuts, -1.4 percent from -4.4 percent;
d. Vegetables, tubers, plantains, cooking bananas and pulses, 24.0 percent from 16.5 percent;
e. Sugar, confectionery and desserts, -1.8 percent from
f. -3.3 percent; and g. Ready-made food and other food products n.e.c., 3.9 percent from 3.2 percent. (Table D)
TECHNICAL NOTES
Uses of CPI
The CPI is most widely used in the calculation of the inflation rate and purchasing power of peso. It is a major statistical series used for economic analysis and as a monitoring indicator of government economic policy.
Computation of CPI The computation of the CPI involves consideration of the following important points:
a. Base Year/Period - A period, usually a year, at which the index number is set to 100. It is the reference point of the index number series.
b. Market Basket - A sample of the thousands of varieties of goods purchased for consumption and services availed by the households in the country selected to represent the composite price behavior of all goods and services purchased by consumers.
c. Weighting System - The weighting pattern uses the expenditures on various consumer items purchased by households as a proportion to total expenditure.
d. Formula - The formula used in computing the CPI is the weighted arithmetic mean of price relatives, the Laspeyre’s formula with a fixed base year period (2006) weights.
e. Geographic Coverage - CPI values are computed at the national, regional, and provincial levels, and for selected cities. Note: CPIs and inflation rates by province and selected city are posted at the PSA website (https://openstat.psa.gov.ph/).
Approved for release:
EMILY P. TOMOGDAN
Chief Statistical Specialist
| Attachment | Size |
|---|---|
|
|
353.65 KB |