
Release Date :
Reference Number :
DAVSUR-2019-002
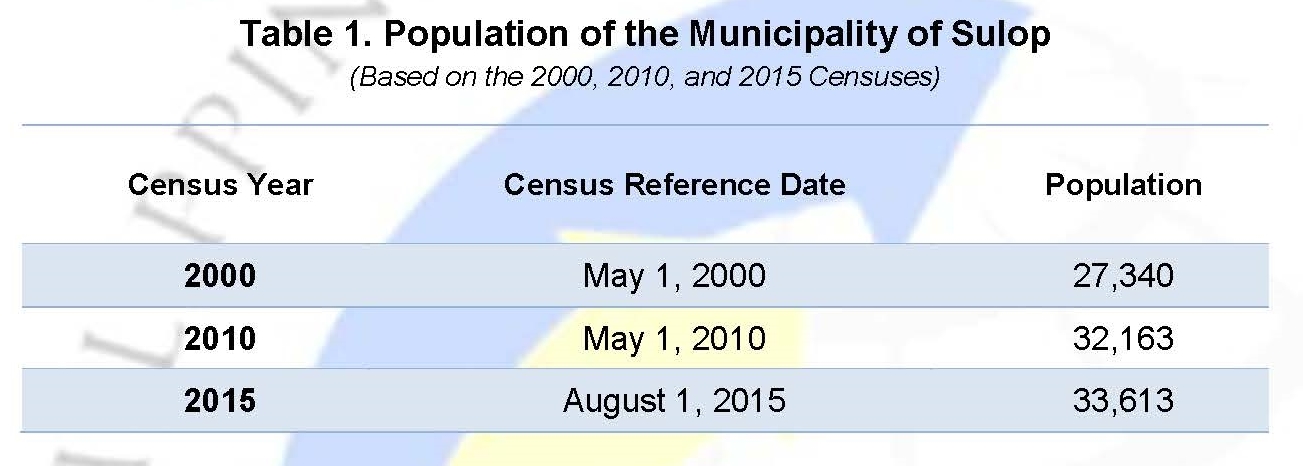 Population of the Municipality of Sulop in 2015 is 33,613.
• The population of the municipality of Sulop, as of August 1, 2015 was 33,613 based on the result 2015 Census of Population (POPCEN 2015).
• The 2015 population is higher by 1,450 compared with the population of 32,163 in 2010, and by 6,248 compared with the population of 27,340 in 2000. Refer to Table 1.
• The population of the Municipality of Sulop increased by 0.84 percent annually, on the average, during the period 2010 to 2015. By comparison, the rate at which the municipality’s population grew during the period 2000 to 2010 was higher at 1.64 percent. See Table 2.
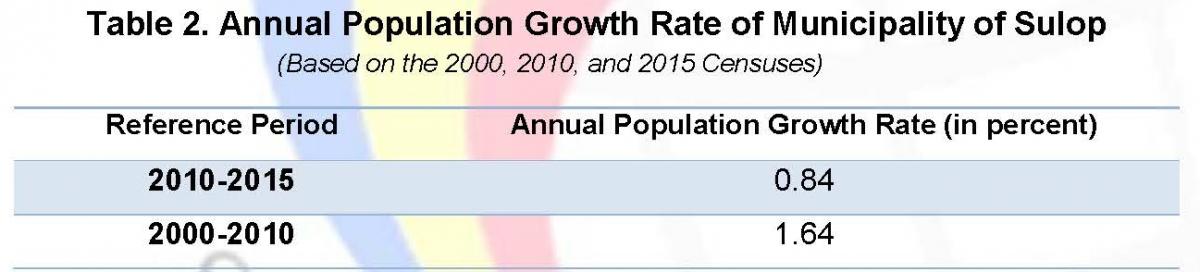
• If the current annual growth rate of the municipality continues, the municipality’s population is expected to double in 82.52years
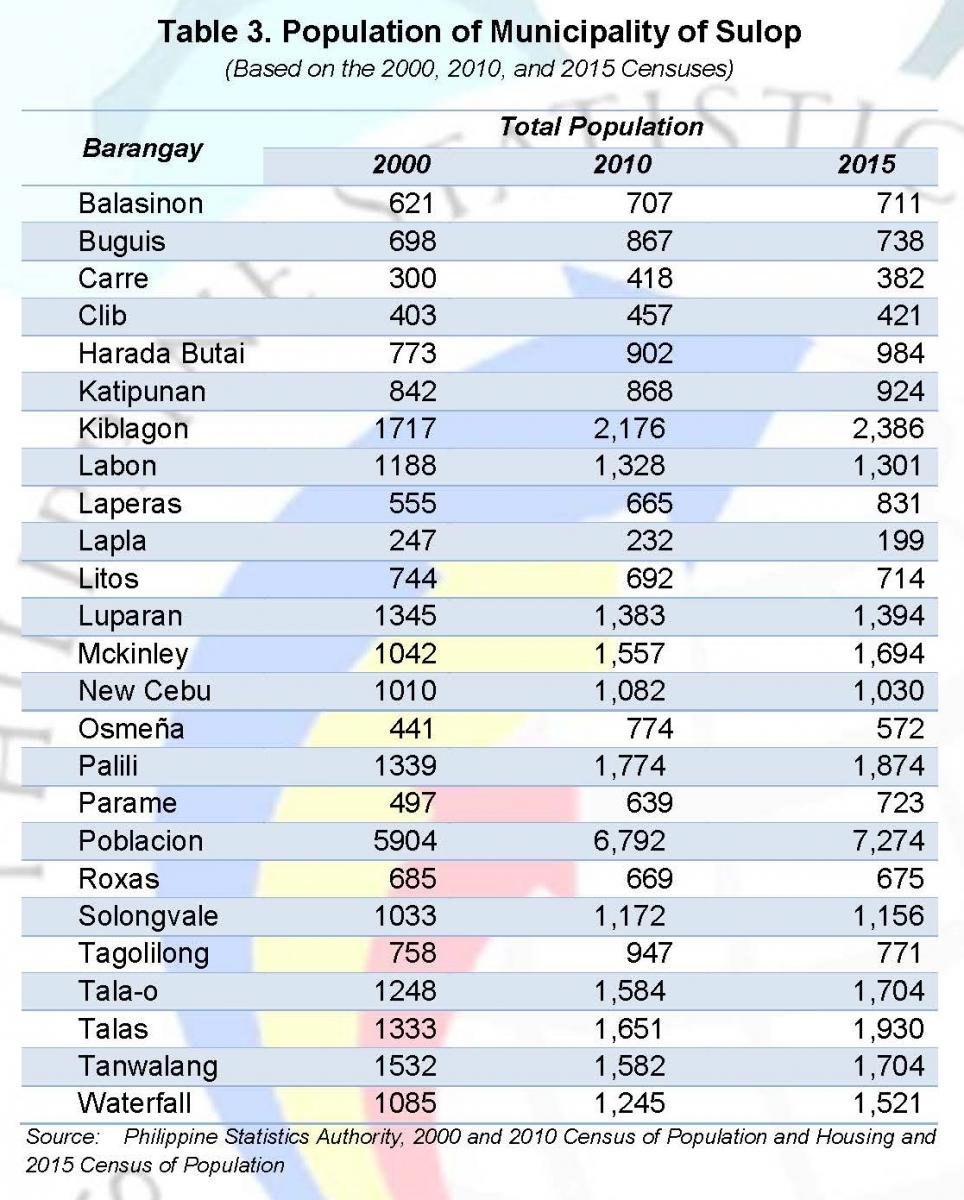
• Barangay Poblacion posted the population of 7,274 persons in 2015 and accounted for about 21.64% of the municipality’s population.
• Municipality of Sulop has 25 barangays. Barangay Poblacion had the biggest population in 2015, followed by Barangay Kiblagon with 2,386 persons, and the Barangay Talas with 1,930 persons. The combined population of these three barangays accounted for about 34.48% percent of the population in Municipality of Sulop in 2015. See Table 3.
• Barangay Lapla was the smallest barangay, in terms of population size with 199 persons in 2015 . See Table 3.
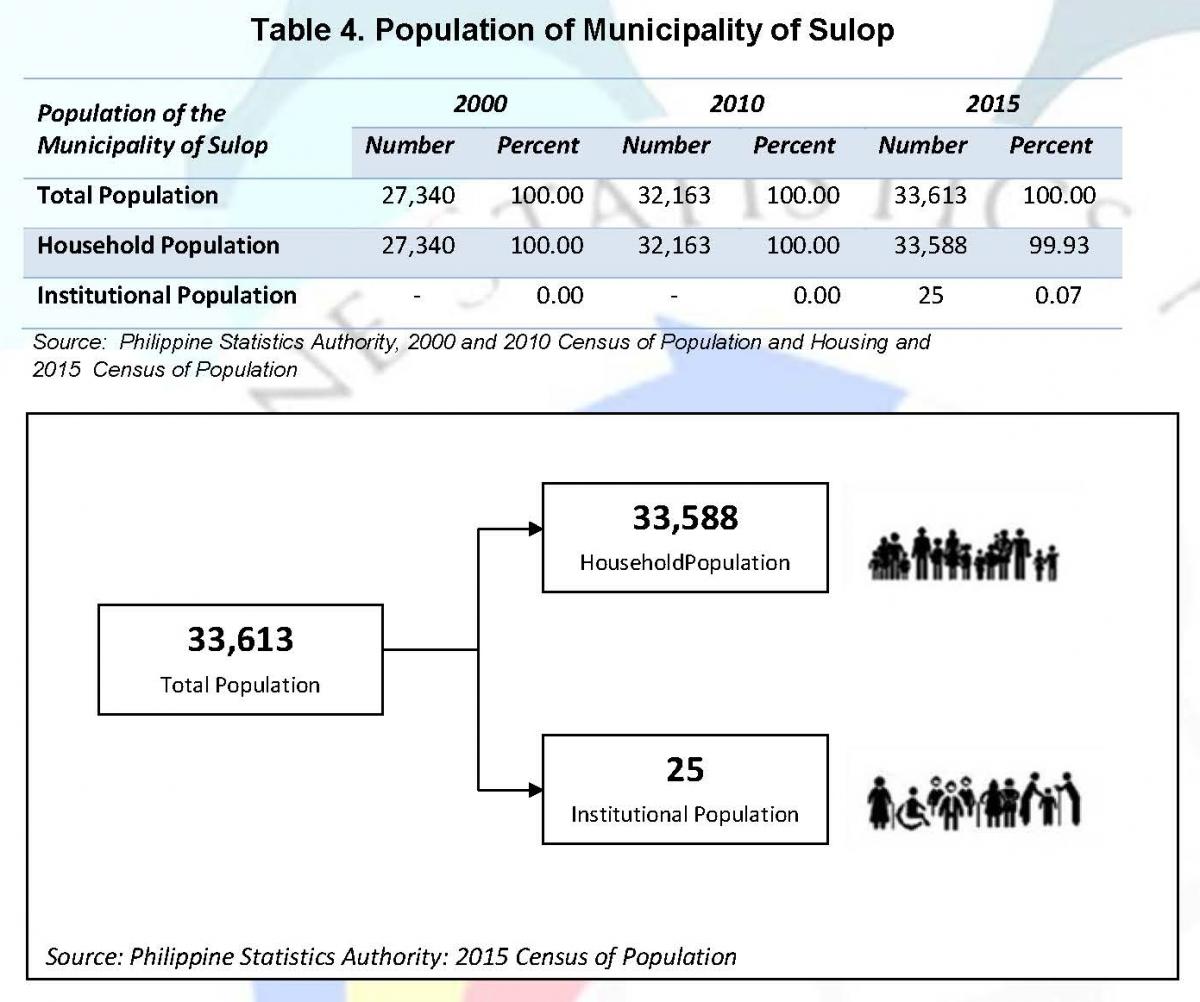
Household population comprised 99.93 percent of the total population.
• The household population of the municipality of Sulop reached 33,588 persons in 2015. This is 1,425 higher than the 32,163 household population reported in 2010, and 6,248 more than the 27,340 household population posted in 2000.
• The household population comprised 99.93 percent of the total population in the municipality of Sulop, while the remaining 0.07 percent is comprised of the institutional population or those residing in collective or institutional living quarters. Please refer to Table 4 and Figure 1.
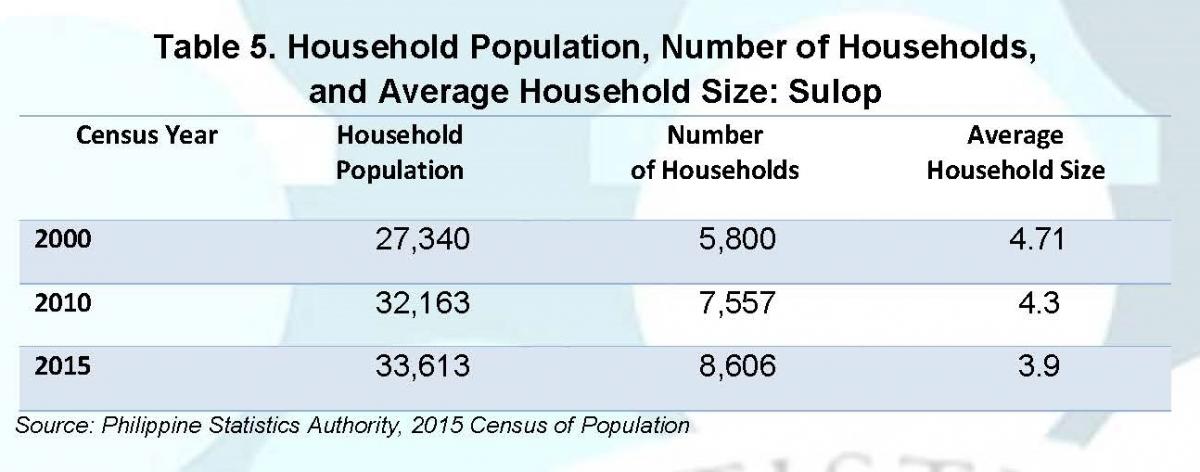
Number of households increased by 1,049 from7,557 in 2010 to 8,606 in 2015.
• The total number of households in the municipality in 2015 was recorded at 8,606 higher by1,049 compared with 7,557 in 2010 and by 2,806 compared with 5,800 in 2000. See Table 5 and Figure 2.
Average household size was 3.9 persons in 2015
• Average household size (AHS) in the municipality of Sulop decreased from 4.3 persons in 2010 to 3.9 persons in 2015. In 2000, there were 4.71persons, on the average, per household.
Approved for Release:
RANDOLF ANTHONY B. GALES
Chief Statistical Specialist
PSA-Davao del Sur
| Attachment | Size |
|---|---|
|
|
2.45 MB |