
Release Date :
Reference Number :
DAVSUR-2019-005
 SPECIAL RELEASE
POPULATION OF THE MUNICIPALITY OF MALALAG
Based on the Results of 2015 Census of Population
Population of the Municipality of Malalag in 2015 is 38,731
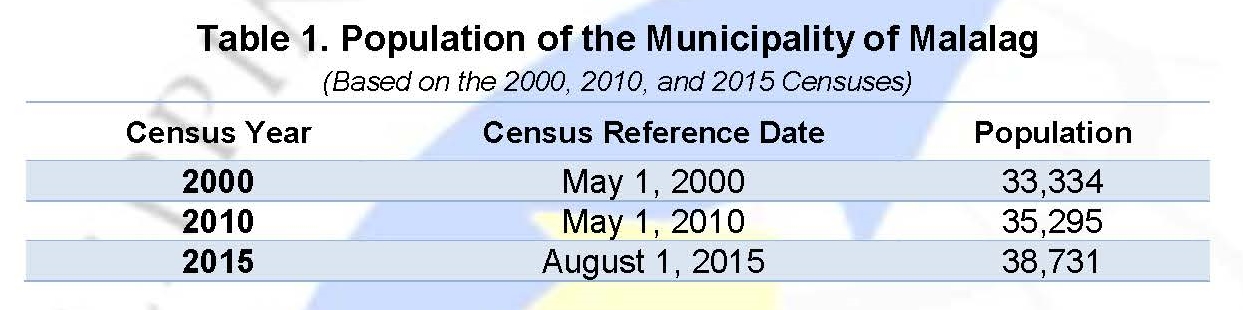
• The population of the Municipality of Malalag, as of August 1, 2015 was 38,731 based on the 2015 Census of Population (POPCEN 2015).
• The 2015 population is higher by 3,436 compared with the population of 35,295in 2010, and by 5,397 compared with the population of 33,334 in 2000. Refer to Table 1.
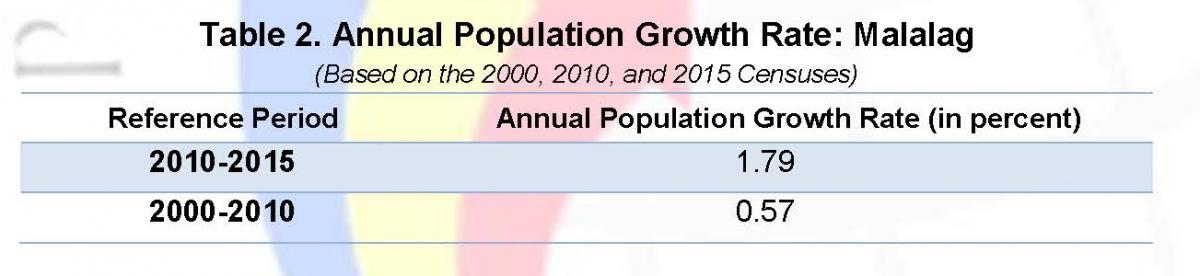
• The population of the Municipality of Malalag increased by 1.79 percent annually, on the average, during the period 2010 to 2015. By comparison, the rate at which the municipality’s population grew during the period 2000 to 2010 was lower at 0.57 percent. See Table 2.
• If the current annual growth rate of the municipality continues, the municipality’s population was expected to double in 39.17years.
• Barangay Poblacion posted a population of 6,208 persons in 2015 and accounted for about 16.03% of the municipality’s population.
• Municipality of Malalag has 15 barangays. Barangay Poblacion had the biggest population in 2015, followed by Barangay Bulacan with 4,833 persons and Barangay Baybay with 4,113 persons. The combined population of these three barangays accounted for about 39.13% percent of the population in the Municipality of Malalagin 2015. See Table 3.
• Barangay Lapu-lapu (Lapla) was the smallest barangay in 2015, in terms of population size, with 572 persons. See Table 3.

Household population comprised 99.77 percent of the total population
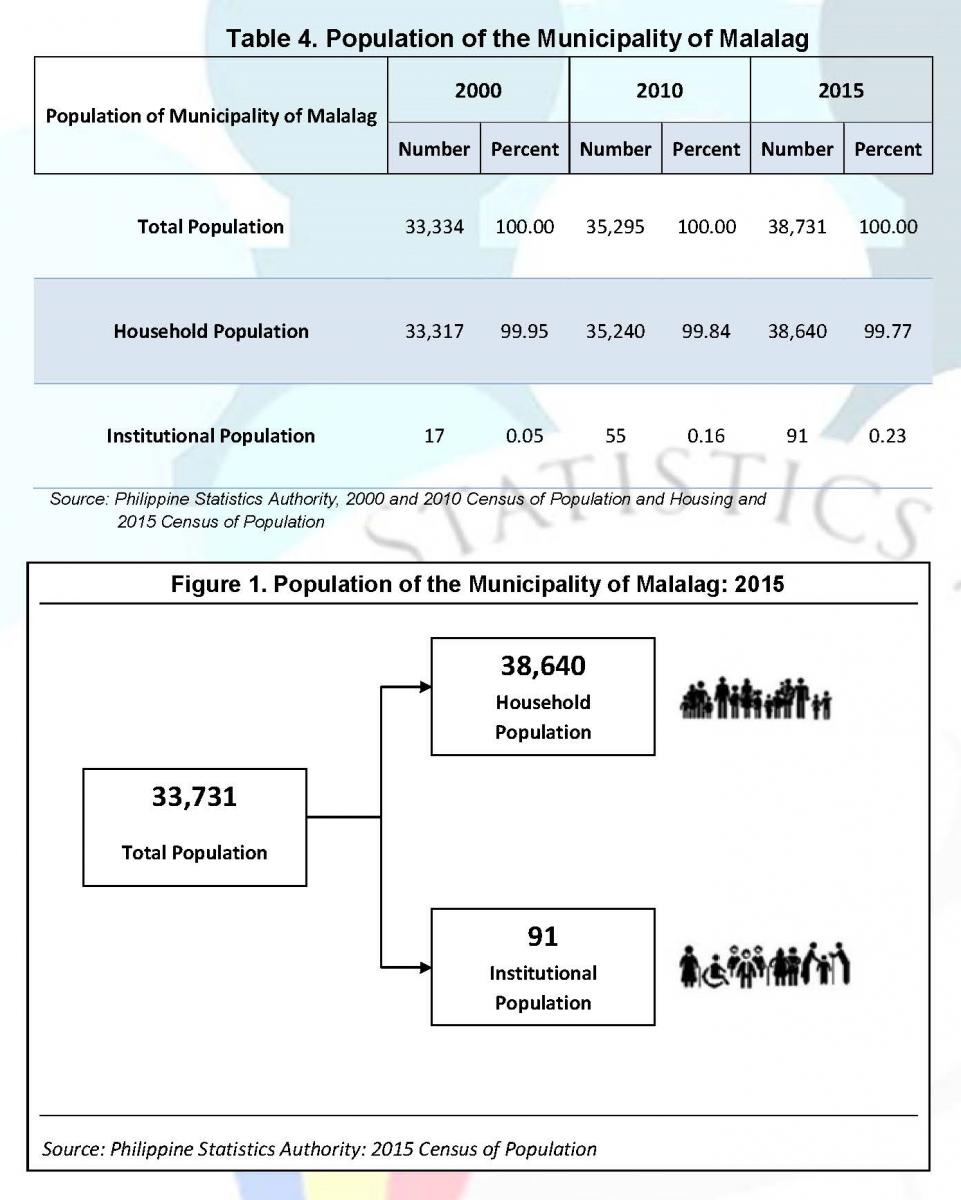
• The household population of Municipality of Malalag reached 38,640 persons in 2015. This is 3,400 higher than the 35,240 household population reported in 2010, and 5,323more than the 33,317 household population posted in 2000.
• The household population comprised 99.77 percent of the total population Municipality of Malalag, while the remaining 0.23 percent is comprised of the institutional population or those residing in collective or institutional living quarters (such as hotels, hospitals, orphanages and home for the aged, corrective and penal institutions and military camps). Please refer to Table 4 and Figure 1.
Number of households increased by 1,735 from 8,632 in 2010 to 7,069 in 2015
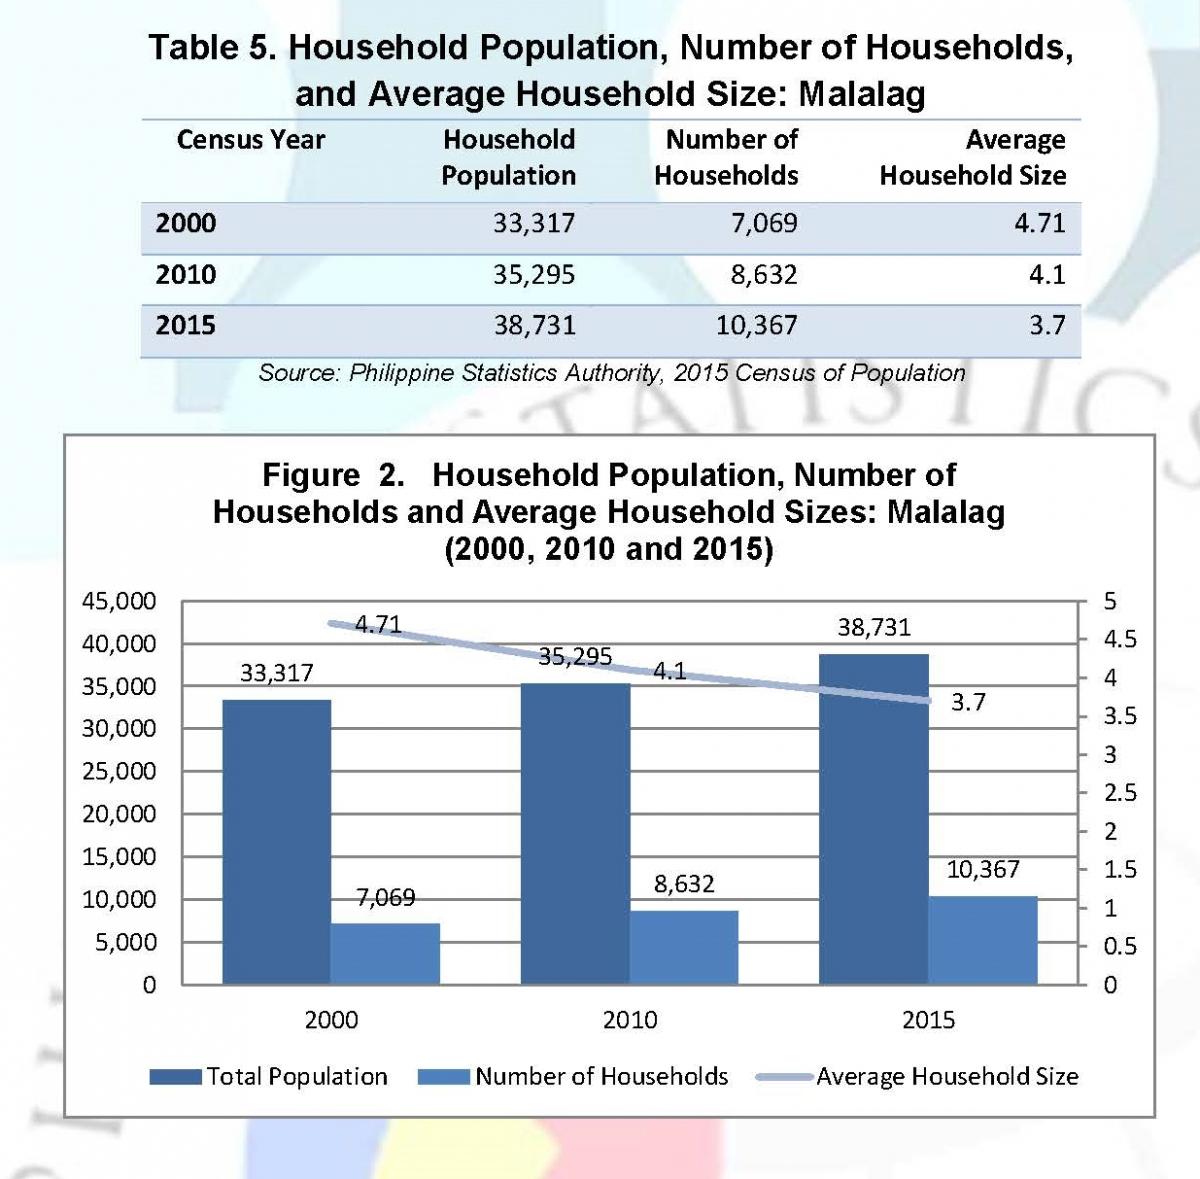
• The total number of households in the municipality in 2015 was recorded at 10,367 higher by 1,735 compared with 8,632 in 2010 and by 3,298 compared with 7,069 in 2000. See Table 5 and Figure 2.
Average household size was 3.7 persons in 2015
• Average household size (AHS) in the Municipality of Malalag decreased from 4.1 persons in 2010 to 3.7 persons in 2015. In 2000, there were 4.71 persons, on the average, per household.
Approved for Release:
RANDOLPH ANTHONY B. GALES
Chief Statistical Specialist
For more details and inquiries of your other data needs, please visit our office at Philippine Statistics Authority, Davao del Sur Provincial Statistical Office located at 3F R&T Yap Bldg., Bangoy corner Monteverde Streets, Davao City. You may visit us at our websites: http//:www.psa.gov.ph or at http//:www.rsso11.psa.gov.
| Attachment | Size |
|---|---|
|
|
4.39 MB |