
Release Date :
Reference Number :
DAVSUR-2021-002
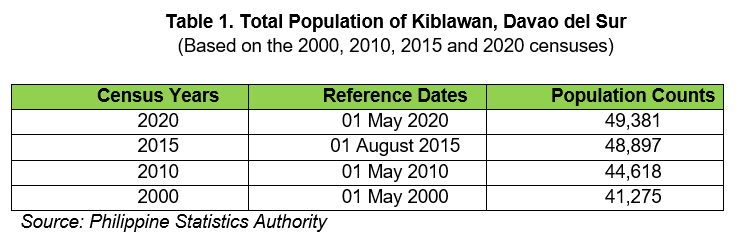
The Municipality of Kiblawan recorded a population count of 49,381
The total population of the Municipality of Kiblawan as of May 1, 2020 was recorded at 49,381 persons based on the 2020 Census of Population and Housing (CPH) conducted during the month of September 2020. It accounted for the about 7.26 percent of the population of Davao del Sur (excluding Davao City) in year 2020.
The population for the municipality for the year 2020 is higher by 484 persons compared with the population of 48,897 in year 2015; by 4,763 persons compared with the population of 44,618 in year 2010; and by 8,106 persons compared with the population of 41,275 in year 2000. (See Table 1)
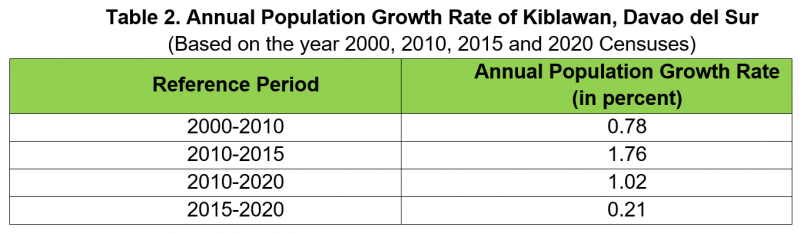
Kiblawan’s population grew by 0.21 percent
The total population of Kiblawan increased by 0.21 percent annually, on average, during the period of 2015 to 2020. By comparison, the rate at which the municipal population grew during the period of 2010 to 2015 was higher at 1.76 percent. (See Table 2)
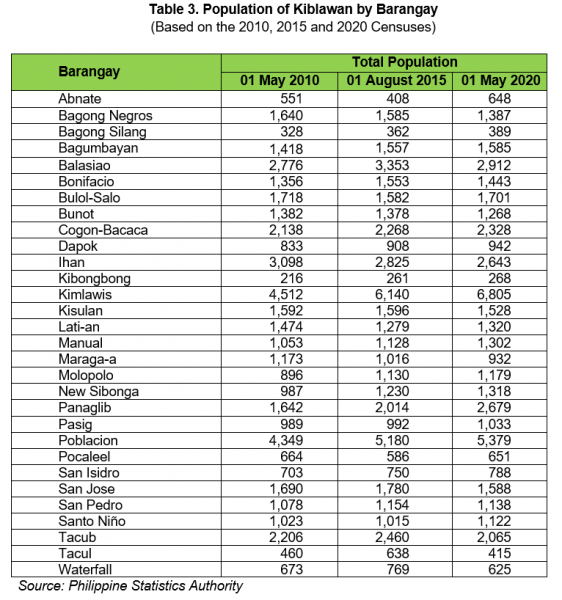
Barangay Kimlawis has the biggest population from among the barangays in Kiblawan
The municipality of Kiblawan has 30 barangays. In 2020, Barangay Kimlawis registered the highest population count with 6,805 persons residing in the barangay. This number accounted to 13.78 percent to the total population of the municipality. It is followed by Barangay Poblacion with a population count of 5,379, which accounted to 10.89 percent to the total municipal population. Following as the third highest populated barangay is Barangay Balasiao with a total population of 2,912 which accounted to 5.9 percent to the total population of the municipality. (See Table 3)
Meanwhile, Barangay Kibongbong registered the least number of residents with a population count of 268 -contributing to just 0.54 percent to the total population of the municipality. The next barangay with the least number of population count is Barangay Bagong Silang with 389 number of persons - just 0.79 percent to the total population followed by Barangay Tacul with 415 number of persons - just 0.84 percent to the total population.
Barangay Abnate is the fastest growing barangay
Barangay Abnate was the fastest growing barangay in the municipality with an average annual Population Growth Rate (PGR) of 10.22 percent during the period of 2015 to 2020. It was followed by Barangay Panaglib with a PGR of 6.19 percent, and Barangay Manual with a PGR of 3.06 percent. (See Table 4)
On the other hand, Barangay Bagumbayan was the slowest growing barangay with a PGR of 0.38 percent, followed by Barangay Cogon-Bacaca with a PGR of 0.55. and Barangay Kibongbong with a PGR of 0.56 percent.
Meanwhile, in the same period, 12 barangays in Kiblawan posted negative PGRs, of which Barangay Tacul has the highest negative PGR of 8.65 percent while Barangay San Pedro has the lowest negative PGR of 0.29 percent.

TECHNICAL NOTES
- The 2020 CPH was undertaken by the Philippine Statistics Authority in September 2020 pursuant to Republic Act No. 10625, also known as the Philippine Statistical Act of 2013 and B.P. Blg. 72 further accorded the PSA the authority to conduct population censuses every ten (10) years beginning in 1980.
- Information on the count of the population were collected with 12:01 a.m. of May 1, 2020 as the census reference time and date.
- The 2020 CPH is the country's 15th Census of Population and 7th Census of Housing since 1903.
- Doubling time is the amount of time it takes for a given population to double in size or value at a constant growth rate. We can find the doubling time for a population undergoing exponential growth by using the Rule of 70. To compute for doubling time, we divide 70 by the growth rate (r).
- His Excellency President Rodrigo R. Duterte declared as official for all purposes the population counts by province, city/municipality, and barangay, based on the 2020 CPH under Proclamation No. 1179 dated 06 July 2021. The population counts were based on census questionnaires accomplished by about 90,000 enumerators deployed during the nationwide census taking.
- The successful completion of the census-taking was made possible with the support of the local and national officials, government agencies, local government units, media, private agencies, and non-government organizations.
Approved for release by:
RANDOLPH ANTHONY B. GALES
Chief Statistical Specialist
Davao del Sur Provincial Statistical Office
| Attachment | Size |
|---|---|
|
|
358.02 KB |